AUD/USD Technical Analysis Signals Breakout Potential

Introduction to AUDUSD
The AUD USD pair, widely known as the Aussie, is one of the most popular major forex pairs in the global currency market. It reflects the value of the Australian dollar against the US dollar and is strongly influenced by commodity prices and global risk sentiment. AUD/USD is often used as a proxy for market optimism due to Australia’s export-driven economy. This makes AUD/USD a key pair for traders focusing on daily forex analysis, macroeconomic trends, and technical trading strategies.
AUD USD Market Overview
AUD/USD continues to trade with a bullish tone on the daily chart, although momentum is showing early signs of slowing near key resistance levels. On the US side, traders are focusing on Factory Orders data, which provides insight into manufacturing demand and future production activity, along with upcoming remarks from Federal Reserve Bank of New York President John Williams. His speech is particularly important, as any hawkish signals could strengthen the US dollar and pressure AUD/USD. Additionally, broader credit conditions data from the Federal Reserve may influence sentiment by reflecting lending activity and economic confidence. On the Australian side, upcoming data such as the Melbourne Institute CPI, ANZ Job Advertisements, and Building Approvals will play a crucial role in shaping expectations around inflation, employment, and economic growth. Overall, AUD/USD is likely to remain sensitive to both US monetary policy signals and Australian economic data, keeping volatility elevated in the near term.
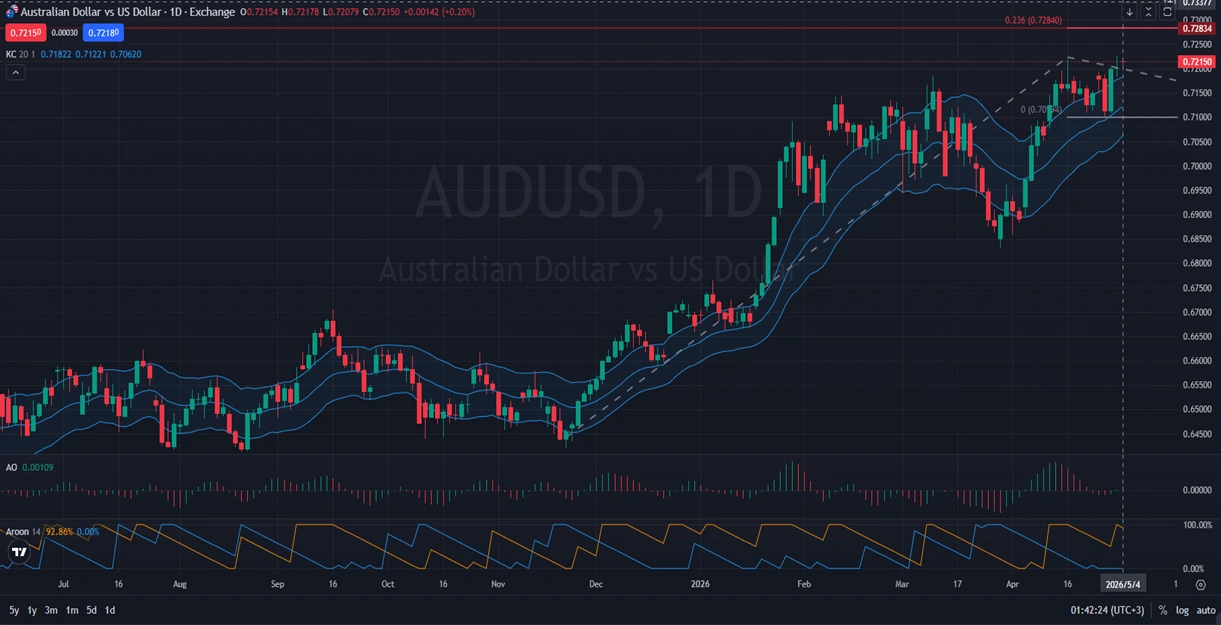
AUD-USD Technical Analysis
On the daily timeframe, AUDUSD shows a strong bullish structure following a sharp upward move, but recent candles indicate that price is struggling to break above the current resistance zone. The appearance of a bullish engulfing candle suggests potential continuation of the upward trend, yet the subsequent doji candle highlights market indecision at these levels. This combination signals that while buyers are still present, they are facing strong resistance pressure. The Keltner Channel levels at 0.71822, 0.71221, and 0.70620 show that price is trading near the upper boundary, which often indicates overextension in the short term. Meanwhile, the Accelerator Oscillator at 0.00109 points to slightly positive momentum, and the Aroon indicator at 92.86% and 0.00% confirms that the overall trend remains strongly bullish. If AUD/USD manages to break above 0.72834, which aligns with the Fibonacci 0.236 level and previous resistance, it could open the path for further upside.
Final words about AUD vs USD
AUD/USD remains in a bullish trend on the daily timeframe, but it is currently facing a key resistance zone that may determine the next directional move. While technical indicators continue to support the upward trend, recent price action suggests hesitation among buyers. A confirmed breakout above resistance could strengthen bullish momentum and lead to further gains, while failure to break higher may result in consolidation or a short-term pullback. Fundamental factors, including US Federal Reserve signals and Australian economic data, will likely play a major role in shaping the next move. For now, AUD/USD daily analysis suggests cautious optimism, with traders closely watching for breakout confirmation.
Disclaimer: This AUDUSD analysis, provided by Unitedpips, is for informational purposes only and does not constitute trading advice. Always conduct your own Forex analysis before making any trading decisions.
Related Posts

EURGBP Price Action Holds Bearish Consolidation
Introduction to EUR-GBPThe EUR-GBP pair shows the exchange rate between the Euro and the British…
NZD/USD Forecast: Consolidation Before Major Move
Introduction to NZDUSDThe NZD USD pair, commonly known as the “Kiwi”, represents the exchange rate…
Gold Outlook: US Inflation Data In Focus
Introduction to Gold/USDThe XAU/USD pair represents the value of Gold against the US Dollar and…