Ripple Daily Chart Signals Consolidation Phase

Introduction to XRP/USD
The XRP/USD pair shows the exchange rate between Ripple’s XRP and the US dollar, making it one of the most watched cryptocurrency pairs in the digital asset market. XRP is commonly associated with Ripple, the blockchain payments company, and is often followed by traders looking for price action linked to cross-border payment technology and broader crypto sentiment. The US dollar side of the XRPUSD pair reflects the strength of the world’s main reserve currency, which means US economic data can strongly influence short-term market direction. For daily XRP-USD analysis, traders usually focus on price trend, momentum indicators, support and resistance levels, and macroeconomic news affecting the dollar.
XRPUSD Market Overview
XRPUSD is currently trading within a cautious market environment after a prolonged bearish trend that began around July 2025, when Ripple price action failed to hold higher levels near the 3.5000 zone. The pair has recently shifted from strong downside movement into a more horizontal consolidation phase around the 1.4000 area, showing that sellers may be losing some momentum while buyers are still not strong enough to confirm a full bullish reversal. On the US dollar side, traders are watching high-frequency ADP private-sector employment data, FHFA house prices, S&P Case-Shiller home price figures, CB Consumer Confidence, Richmond manufacturing data, and API energy inventory updates, as these indicators can shape expectations for US economic strength and Federal Reserve policy. Stronger-than-expected US employment, housing, consumer confidence, or manufacturing data would usually support the US dollar and may add pressure on XRPUSD. In addition, geopolitical headlines involving Iran, Russia ties, and potential US-Iran negotiations may affect risk sentiment, which is important for cryptocurrency pairs because digital assets often react sharply to shifts in global uncertainty. Overall, the Ripple vs US dollar daily outlook remains technically fragile, with XRP price still needing a stronger breakout signal before traders can treat the current sideways range as a reliable recovery phase.
XRP Technical Analysis
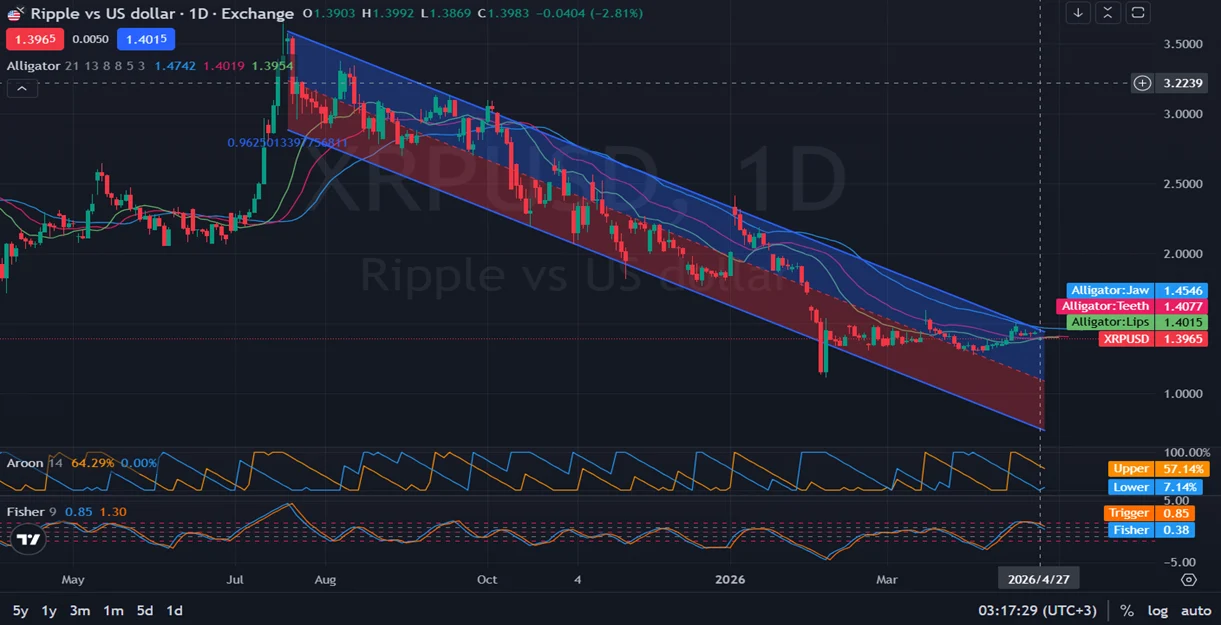
Looking at the XRP/USD daily chart, Ripple price has been moving inside a clear descending channel since the July 2025 peak, confirming that the broader daily trend remains bearish despite the recent sideways movement near 1.4000. Current price action is ranging around 1.3965–1.4015, with the chart showing the Alligator indicator lines positioned in a bearish structure: the blue Jaw line is at the top near 1.4546, the red Teeth line is below it near 1.4077, and the green Lips line is close to price near 1.4015. This alignment suggests that XRPUSD has not yet confirmed a bullish trend reversal, although the recent compression near the Alligator lines shows that the market may be preparing for a larger directional move. The Aroon indicator shows the upper line near 57.14% and the lower line near 7.14%, while the displayed values of 64.29% and 0.00% suggest improving upside pressure but not yet a complete trend shift. The Fisher indicator is also mixed, with values around 0.85 and 1.30, while the trigger level near 0.85 and Fisher reading near 0.38 show that bullish momentum has appeared but remains uneven. From a support and resistance perspective, XRPUSD support is likely near the recent consolidation base around 1.3000–1.3500, while resistance is seen near 1.4500, followed by the descending channel resistance area and the higher 2.0000 psychological level. A daily close above the Alligator Jaw and channel resistance could improve the XRPUSD technical outlook, while failure to hold above 1.3965 may expose Ripple price to renewed downside pressure.
Final words about XRP vs USD
The XRP vs US dollar outlook remains cautious on the daily time frame because the pair is still trading under the influence of a larger descending trend. Although recent XRP-USD price action shows consolidation around the 1.4000 level, the pair has not yet delivered a strong bullish breakout that would confirm a sustainable recovery. Traders should closely monitor the 1.4500 resistance region, the descending channel top, and the Alligator indicator structure for signs of renewed bullish momentum. On the downside, losing the current range could return focus to lower XRP support zones and keep sellers in control of the Ripple daily trend. US economic releases, especially ADP employment data, housing indicators, consumer confidence, manufacturing activity, and energy-related news, may continue to influence the US dollar and therefore affect XRP-USD volatility. For now, XRP/USD daily analysis suggests a neutral-to-bearish outlook unless Ripple price breaks decisively above resistance with stronger momentum confirmation.
Disclaimer: This XRPUSD analysis, provided by Unitedpips, is for informational purposes only and does not constitute trading advice. Always conduct your own Forex analysis before making any trading decisions.
Related Posts

EURGBP Price Action Holds Bearish Consolidation
Introduction to EUR-GBPThe EUR-GBP pair shows the exchange rate between the Euro and the British…
NZD/USD Forecast: Consolidation Before Major Move
Introduction to NZDUSDThe NZD USD pair, commonly known as the “Kiwi”, represents the exchange rate…
Gold Outlook: US Inflation Data In Focus
Introduction to Gold/USDThe XAU/USD pair represents the value of Gold against the US Dollar and…