BTCUSD Price Forecast: Bulls Attempt Market Recovery

Introduction to BTC/USD
The BTC USD pair represents the exchange rate between Bitcoin and the US dollar, often referred to as the benchmark for the cryptocurrency market. Bitcoin, sometimes called digital gold, is the leading decentralized asset, while the US dollar remains the dominant global reserve currency. BTC/USD is widely followed by traders and investors due to its volatility and sensitivity to macroeconomic conditions. This pair is essential for those focusing on crypto trading, price speculation, and daily technical analysis.
BTC USD Market Overview
BTC/USD is currently stabilizing after a strong bearish phase, with market sentiment gradually improving as traders reassess macroeconomic conditions. On the US side, key economic indicators such as GDP, Core PCE, and Jobless Claims continue to shape expectations around Federal Reserve policy, which indirectly impacts Bitcoin through liquidity and risk appetite. Stronger US data tends to support the US dollar and may limit BTC/USD upside, while weaker data could encourage flows into risk assets like Bitcoin. Upcoming releases, including Personal Income, Consumer Spending, and the Chicago PMI, are also important as they provide insight into economic strength and demand conditions. Overall, BTC/USD remains sensitive to shifts in inflation expectations, interest rate outlooks, and broader financial market sentiment.
BTC-USD Technical Analysis
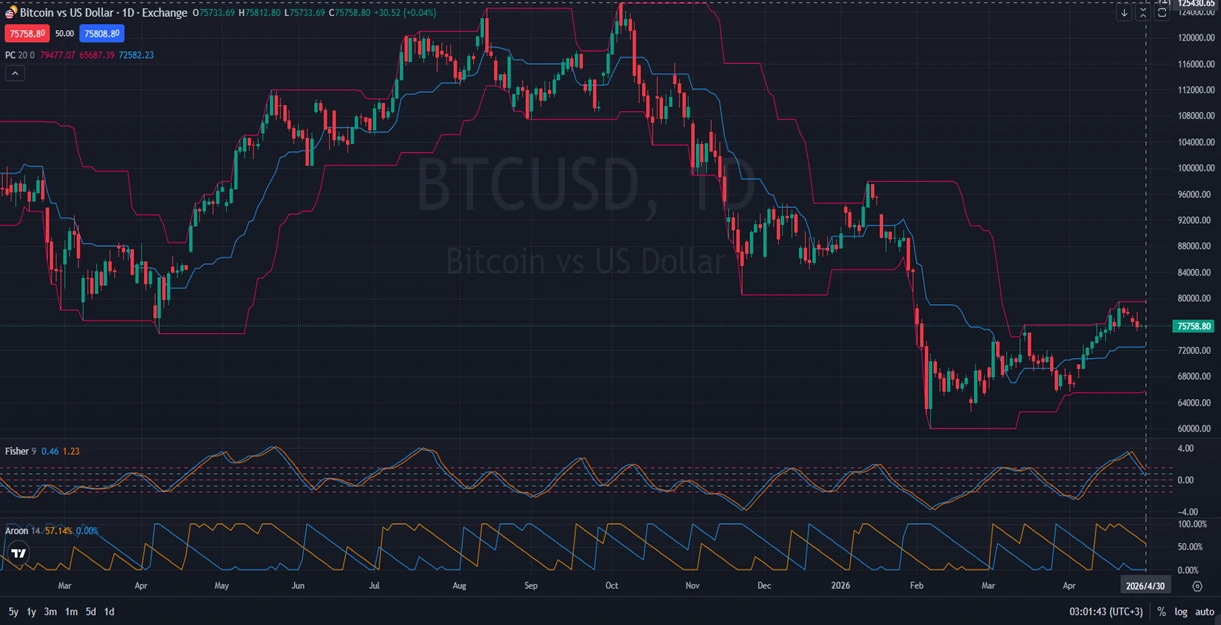
On the daily chart, BTC USD shows signs of recovery after a strong bearish trend, with candles beginning to form a gradual and steady bullish structure. Although the recent upward moves are not very strong, they indicate that selling pressure may be weakening. The latest correction following the most recent upward push appears to have ended, suggesting that buyers are attempting to regain control. The Price Channel levels at 79477.07, 65687.39, and 72582.23 show that BTC/USD is trading within a recovery zone but still below major resistance. The Fisher indicator at 0.46 and 1.23 supports a developing bullish momentum, while the Aroon indicator at 57.14% and 0.00% indicates that the upward trend is beginning to strengthen. Overall, BTC/USD technical analysis points to a potential continuation of the recovery if momentum continues to build.
Final words about BTC VS USD
BTCUSD appears to be transitioning from a bearish phase into a potential recovery trend, but confirmation is still needed. The current price action suggests that buyers are gradually returning, although momentum remains moderate rather than strong. Macroeconomic factors, especially US economic data and Federal Reserve expectations, will continue to influence Bitcoin’s direction through their impact on liquidity and risk appetite. A sustained move higher could strengthen bullish sentiment, while failure to hold current levels may lead to renewed downside pressure. For now, BTC/USD daily analysis suggests cautious optimism, with traders watching for stronger confirmation of trend continuation.
Disclaimer: This BTCUSD analysis, provided by Unitedpips, is for informational purposes only and does not constitute trading advice. Always conduct your own Forex analysis before making any trading decisions.
Related Posts

EURGBP Price Action Holds Bearish Consolidation
Introduction to EUR-GBPThe EUR-GBP pair shows the exchange rate between the Euro and the British…
NZD/USD Forecast: Consolidation Before Major Move
Introduction to NZDUSDThe NZD USD pair, commonly known as the “Kiwi”, represents the exchange rate…
Gold Outlook: US Inflation Data In Focus
Introduction to Gold/USDThe XAU/USD pair represents the value of Gold against the US Dollar and…