Japanese Yen Strengthens After USDJPY Resistance Rejection

Introduction to USD/JPY
The USD/JPY pair shows the exchange rate between the US Dollar and the Japanese Yen, one of the most traded currency pairs in the global forex market. This pair is often nicknamed the “Ninja” and is closely watched by traders because it reflects the relationship between US monetary conditions and Japanese economic sentiment. USD-JPY daily analysis is important for understanding dollar strength, yen demand, interest-rate expectations, and global risk appetite. The pair is currently trading near a sensitive technical zone after a strong rejection from higher levels.
USDJPY Market Overview
USDJPY is currently showing signs of bearish pressure on the daily time frame, especially after the US Dollar failed to hold gains near the 160.00 psychological resistance area. For the US Dollar, traders are focused on upcoming manufacturing-related data, including the S&P Global Manufacturing PMI, ISM Manufacturing PMI, ISM Prices Paid, and domestic vehicle sales from Wards Auto. These indicators are important for the US Dollar Japanese Yen forecast because stronger-than-expected PMI or prices-paid figures can support the dollar by signaling business expansion or inflation pressure. On the Japanese Yen side, Tokyo Core CPI remains a key inflation indicator because it gives an early view of national consumer price trends and can influence expectations around Bank of Japan policy. Japan’s S&P Global Manufacturing PMI is also relevant because it reflects the health of the manufacturing sector and broader economic momentum. Overall, the USDJPY market outlook is being shaped by the contrast between US economic resilience, Japanese inflation signals, and the recent technical rejection from elevated price levels.
USD-JPY Technical Analysis
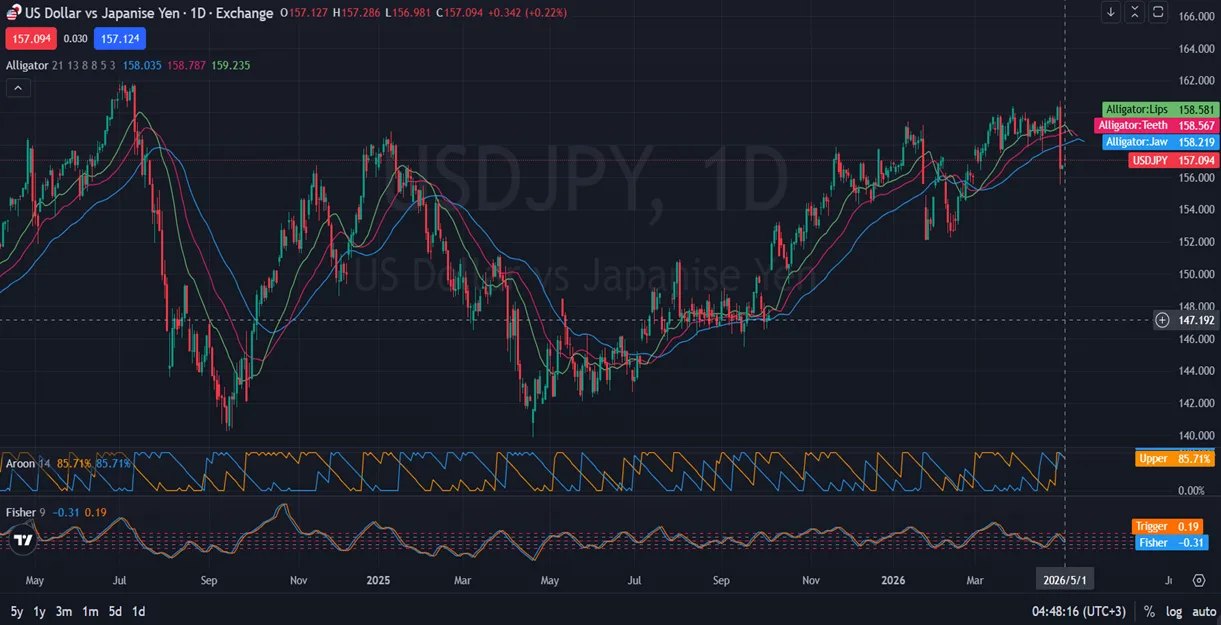
From a USD-JPY technical analysis perspective, the daily chart shows that the pair rejected strongly from the 160.00 zone, forming a sharp bearish daily candle that signals selling pressure near a major resistance area. Price is currently trading around 157.09 and has moved below the Alligator indicator lines, with the Lips, Teeth, and Jaw positioned above the market, which supports a short-term bearish bias. The first resistance is around 158.60, and a recovery above this level would be needed to reduce downside pressure and shift the USDJPY daily outlook back toward a more neutral or bullish structure. The first support is around 156.00, which is the key downside level to watch if sellers continue to control the price action. The Aroon indicator still shows strong upper momentum readings, but the recent bearish candle suggests that buyers may be losing control after the rally. The Fisher indicator is also below its trigger line, supporting the view that bearish momentum may continue in the near term unless the pair climbs back above 158.60.
Final words about US Dollar vs Japanese Yen
The current US Dollar vs Japanese Yen outlook remains cautious after the strong rejection from the 160.00 resistance zone. As long as USDJPY stays below 158.60, the daily bias favors further weakness toward the 156.00 support area. Traders should closely monitor US PMI data, ISM Manufacturing PMI, ISM Prices Paid, auto sales, Tokyo Core CPI, and Japan Manufacturing PMI because these releases can affect both dollar strength and yen sentiment. A break below 156.00 may increase bearish momentum and open the door for a deeper correction on the D1 chart. However, if the pair recovers above 158.60, the market could attempt to stabilize and retest higher resistance levels. For now, USDJPY daily analysis suggests that price action, support and resistance, and momentum indicators all point to a bearish short-term setup.
Disclaimer: This USDJPY analysis, provided by Unitedpips, is for informational purposes only and does not constitute trading advice. Always conduct your own Forex analysis before making any trading decisions.
Related Posts

EURGBP Price Action Holds Bearish Consolidation
Introduction to EUR-GBPThe EUR-GBP pair shows the exchange rate between the Euro and the British…
NZD/USD Forecast: Consolidation Before Major Move
Introduction to NZDUSDThe NZD USD pair, commonly known as the “Kiwi”, represents the exchange rate…
Gold Outlook: US Inflation Data In Focus
Introduction to Gold/USDThe XAU/USD pair represents the value of Gold against the US Dollar and…