GBP/USD Analysis: Downtrend and Key Technical Levels

Introduction to GBP/USD
The GBP/USD pair, widely known as “Cable,” reflects the exchange rate between the British Pound (GBP) and the US Dollar (USD). It is one of the most actively traded forex pairs, offering high liquidity and volatility. The nickname “Cable” originates from the undersea cable used to transmit exchange rate data between London and New York in the 19th century. This pair is a key barometer of the economic relationship between the UK and the US, heavily influenced by macroeconomic news and monetary policies.
GBP/USD Market Overview
The GBP/USD pair remains under significant downward pressure, as the US Dollar continues to strengthen on the back of resilient economic data. Today, the market is closely watching the release of the US GDP report and initial jobless claims, which are expected to reinforce the Federal Reserve’s hawkish stance. Strong data could further boost the USD, placing additional strain on the GBP. On the UK side, the British Pound remains vulnerable amid ongoing economic uncertainty and subdued growth prospects. Traders are awaiting the next Bank of England (BoE) monetary policy decision, with expectations of further cautious tones as inflationary pressures persist. Over the next 24 hours, heightened volatility is anticipated, driven by key economic data releases from the US, which will likely dictate the pair’s short-term direction.
GBP/USD Technical Analysis
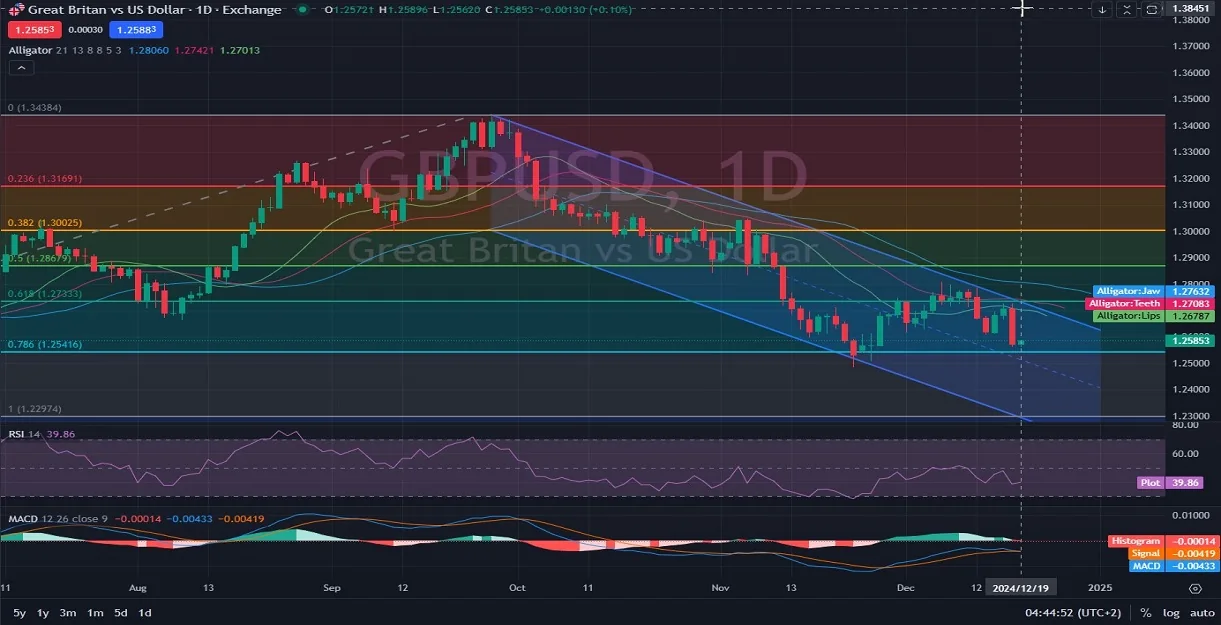
The daily chart for GBP/USD highlights a persistent downtrend, with the price trading within a descending channel and positioned between the 0.786 and 0.618 Fibonacci retracement levels, signaling an area of strong bearish momentum. The Alligator indicator, with its blue jaw, red teeth, and green lips, confirms a bearish alignment, suggesting the continuation of downward momentum as the lines diverge. Meanwhile, the RSI stands at 39.86, indicating a bearish bias without reaching oversold territory, leaving room for further declines before a potential rebound. The MACD adds to the bearish sentiment, as the MACD line crosses below the signal line, and the histogram reflects weakening momentum. Immediate support is seen at 1.25416 (0.786 Fibonacci level), while a break below this could push the pair toward the critical psychological level of 1.22974. On the upside, resistance lies at 1.27333 (0.618 Fibonacci level), with further resistance at 1.28679, where previous price consolidation occurred. Traders should remain cautious, as the combination of bearish technical signals and significant upcoming US data makes the pair prone to sharp moves.
Final Words on GBP/USD
The GBP/USD pair continues to exhibit strong bearish momentum, driven by technical factors and reinforced by fundamental pressures. The key support at 1.25416 will likely play a pivotal role in determining the next direction; a break below this level could open the door for further declines toward 1.22974. Conversely, a bounce from support may trigger a short-term correction toward resistance levels at 1.27333 and 1.28679, though any sustained recovery seems unlikely in the current market environment. With major US economic data releases imminent, the USD’s performance will remain the primary driver of the pair’s movement. Traders are advised to monitor both technical levels and fundamental developments closely, as heightened volatility is expected in the coming sessions.
12.19.2024
Related Posts

EURGBP Price Action Holds Bearish Consolidation
Introduction to EUR-GBPThe EUR-GBP pair shows the exchange rate between the Euro and the British…
NZD/USD Forecast: Consolidation Before Major Move
Introduction to NZDUSDThe NZD USD pair, commonly known as the “Kiwi”, represents the exchange rate…
Gold Outlook: US Inflation Data In Focus
Introduction to Gold/USDThe XAU/USD pair represents the value of Gold against the US Dollar and…