Gold Daily Analysis: Triangle Breakout Approaches

Introduction to Gold
Gold/USD, commonly referred to as XAU/USD, measures the value of one ounce of gold against the US dollar. Gold is widely considered a safe-haven asset and is heavily influenced by inflation expectations, geopolitical tensions, central bank policies, and US economic performance. Traders and investors closely follow Gold daily analysis because the precious metal often reacts strongly to interest rate expectations and fluctuations in US dollar strength. As one of the most actively traded commodities in the financial markets, Gold/USD remains a major focus for both short-term traders and long-term investors.
Gold Market Overview
XAU/USD prices have recently entered a consolidation phase as traders weigh safe-haven demand against expectations surrounding future Federal Reserve policy. Upcoming US economic releases, including the Philadelphia Fed Manufacturing Index, Initial Jobless Claims, Building Permits, Housing Starts, and S&P Global Manufacturing and Services PMI reports, are expected to significantly influence US dollar sentiment and gold market volatility. Stronger-than-expected economic data could strengthen the US dollar and place additional pressure on gold prices, while weaker figures may revive demand for bullion as a defensive asset. Investors are also paying close attention to speeches from Federal Reserve officials, including Richmond Fed President Thomas Barkin, for clues regarding future interest rate direction and inflation concerns. Meanwhile, ongoing uncertainty surrounding global economic growth and monetary policy continues to support long-term interest in gold despite the current sideways price action.
XAUUSD Technical Analysis
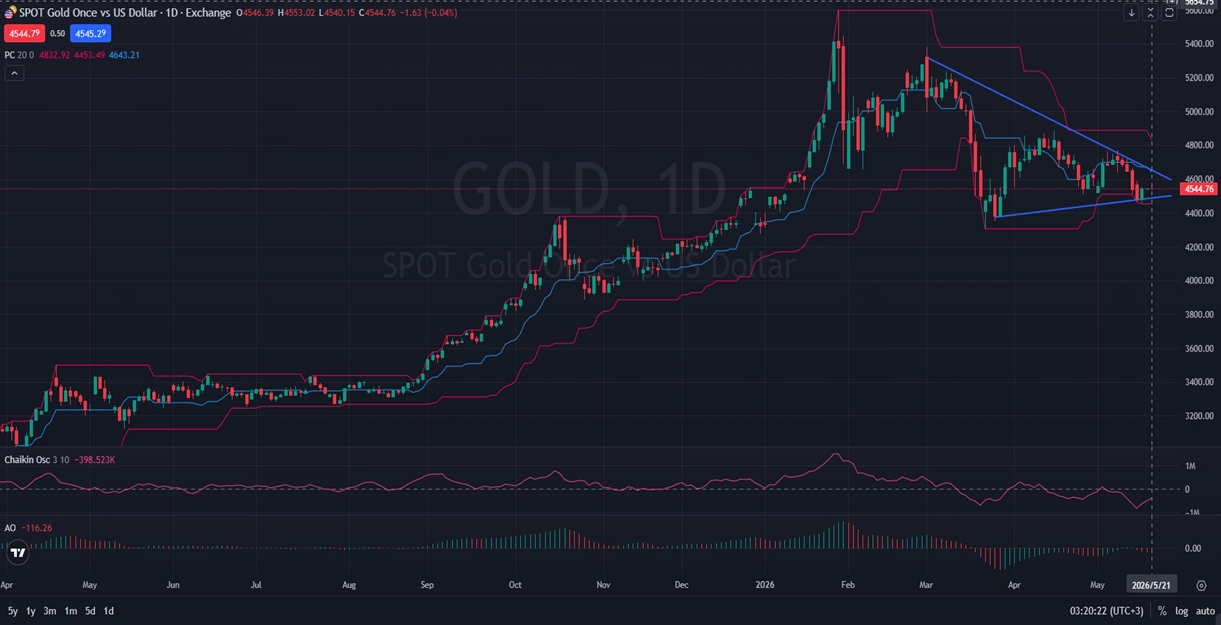
On the daily timeframe, Gold/USD is forming a symmetrical triangle pattern characterized by lower highs and gradually higher lows, signaling increasing market indecision as price approaches the apex of the formation. This structure typically suggests that a significant breakout could occur soon, with momentum likely accelerating in whichever direction the breakout develops. The Price Channel indicator levels at 4832.92, 4453.49, and 4643.21 highlight the broader consolidation range currently controlling price movement. Meanwhile, the Chaikin Oscillator reading of -398.523K reflects weakening buying pressure and reduced capital inflows into the gold market. In addition, the Awesome Oscillator value of -116.26 indicates bearish momentum remains active despite recent stabilization attempts. If buyers manage to break above the upper boundary of the triangle, bullish momentum could quickly target higher resistance levels, while a downside breakout may trigger a continuation of the corrective bearish trend.
Final words about Gold
Gold/USD remains at a technically critical stage as the market compresses within a tightening triangular formation. Upcoming US economic data and Federal Reserve commentary will likely determine whether gold breaks higher or extends its recent correction lower. Traders should closely monitor the triangle boundaries because breakout confirmation could generate strong directional momentum in the days ahead. While bearish momentum indicators still dominate the short-term outlook, broader uncertainty surrounding inflation and global growth continues to provide underlying support for gold prices. Overall, Gold daily analysis suggests that volatility may increase significantly once the current consolidation phase reaches its conclusion.
Disclaimer: This XAUUSD analysis, provided by Unitedpips, is for informational purposes only and does not constitute trading advice. Always conduct your own Forex analysis before making any trading decisions.
Related Posts

EURGBP Price Action Holds Bearish Consolidation
Introduction to EUR-GBPThe EUR-GBP pair shows the exchange rate between the Euro and the British…
NZD/USD Forecast: Consolidation Before Major Move
Introduction to NZDUSDThe NZD USD pair, commonly known as the “Kiwi”, represents the exchange rate…
Gold Outlook: US Inflation Data In Focus
Introduction to Gold/USDThe XAU/USD pair represents the value of Gold against the US Dollar and…