NZD/USD Forecast Today: Kiwi Awaits Direction

Introduction to NZDUSD
The NZD USD pair, commonly known as the Kiwi, represents the exchange rate between the New Zealand dollar and the US dollar. This forex pair is highly influenced by commodity prices, global risk sentiment, and economic data from both New Zealand and the United States. NZD/USD is popular among forex traders because of its volatility and sensitivity to interest rate expectations and economic growth trends. Monitoring NZD/USD daily analysis helps traders identify market momentum, breakout opportunities, and key support and resistance levels.
NZD USD Market Overview
NZD/USD remains under pressure within a broader bearish trend, although recent price action suggests that buyers are attempting to stabilize the pair. Traders are closely monitoring New Zealand Producer Price Index (PPI) data, as rising producer costs could increase inflation expectations and support the New Zealand dollar through potential Reserve Bank of New Zealand policy adjustments. On the US side, upcoming NAHB Housing Market Index figures are expected to provide fresh insight into the strength of the American housing sector and overall economic confidence. Investors are also watching Treasury International Capital (TIC) data, which measures foreign demand for US securities and can influence US dollar strength through capital inflows. Overall market sentiment remains cautious, with traders balancing expectations for US monetary policy against concerns over slowing global growth and commodity market volatility.
NZD-USD Technical Analysis
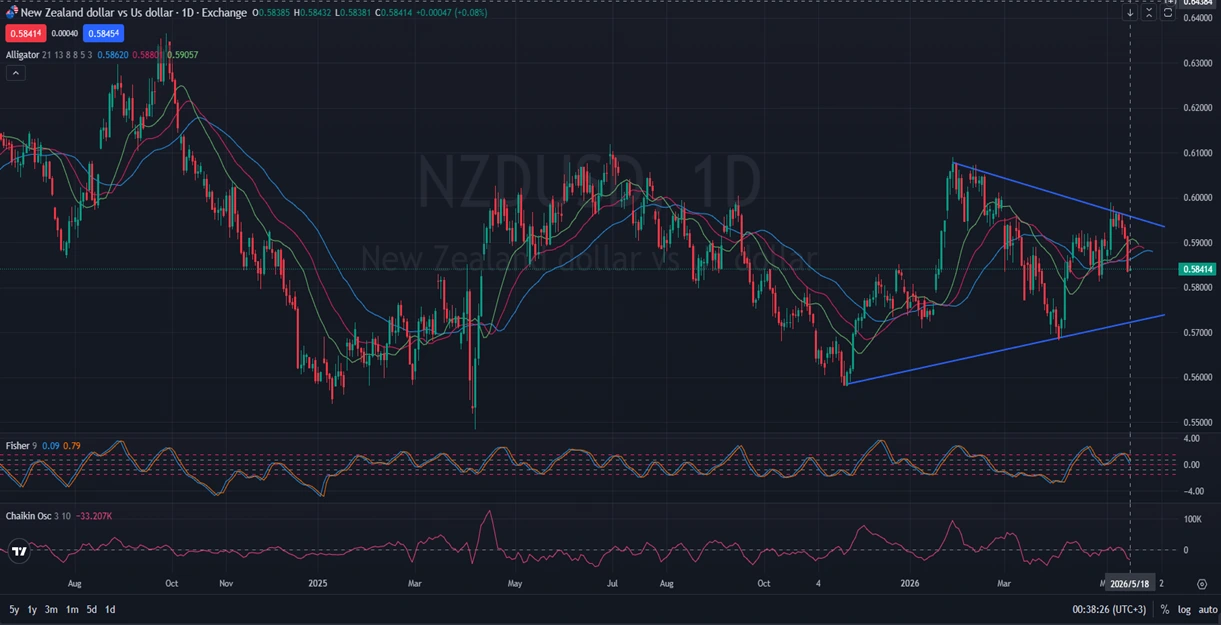
On the daily timeframe, NZDUSD has been moving lower for an extended period, confirming the broader bearish structure that has dominated the chart. However, the symmetrical triangle pattern forming near the end of the chart resembles a classic bullish pennant, which could signal a potential breakout to the upside if buyers gain momentum. Despite this possibility, the long-term bearish trend still limits bullish confidence, making the triangle pattern neutral until a confirmed breakout occurs. The Williams Alligator indicator values at 0.58620, 0.5880, and 0.59057 suggest the market is currently consolidating, with moving averages tightly grouped together. Meanwhile, the Fisher indicator at 0.09 and 0.79 points to weakening bullish momentum, while the Chaikin Oscillator reading of -33.207K reflects ongoing selling pressure and weaker capital inflows. A breakout above the upper trendline could trigger a bullish continuation toward higher resistance zones, while a break below support may restart the broader downtrend.
Final words about NZD vs USD
NZD USD is currently trading in a critical technical zone where the market is waiting for confirmation of the next major move. The symmetrical triangle pattern suggests volatility compression, which is often followed by a strong directional breakout. Economic releases from both New Zealand and the United States will likely determine whether buyers or sellers gain control in the near term. Traders should closely monitor inflation-related indicators, US housing data, and overall US dollar strength for further clues about market direction. For now, NZD/USD daily analysis indicates a cautious outlook, with breakout confirmation needed before stronger bullish or bearish momentum can fully develop.
Disclaimer: This NZDUSD analysis, provided by Unitedpips, is for informational purposes only and does not constitute trading advice. Always conduct your own Forex analysis before making any trading decisions.
Related Posts

EURGBP Price Action Holds Bearish Consolidation
Introduction to EUR-GBPThe EUR-GBP pair shows the exchange rate between the Euro and the British…
NZD/USD Forecast: Consolidation Before Major Move
Introduction to NZDUSDThe NZD USD pair, commonly known as the “Kiwi”, represents the exchange rate…
Gold Outlook: US Inflation Data In Focus
Introduction to Gold/USDThe XAU/USD pair represents the value of Gold against the US Dollar and…