BTC/USD Outlook: Bitcoin Rebounds After Sharp Drop

Introduction to BTCUSD
The BTC USD pair represents the exchange rate between Bitcoin and the US dollar and remains the main benchmark for the cryptocurrency market. Bitcoin, often called digital gold, is widely traded as a speculative asset, inflation hedge, and alternative store of value. BTC/USD is highly sensitive to US economic data, Federal Reserve policy expectations, liquidity conditions, and broader risk sentiment. This makes BTC/USD one of the most important instruments for daily crypto analysis, Bitcoin price forecasts, and technical trading strategies.
BTC-USD Market Overview
BTC/USD is currently attempting to recover after a major bearish decline, but the broader market still remains sensitive to US dollar direction and macroeconomic data. Traders are watching US Core Retail Sales and Retail Sales closely, as stronger consumer spending could support the US dollar and pressure Bitcoin by reinforcing expectations for tighter Federal Reserve policy. Jobless Claims will also be important, since labor-market weakness may increase risk appetite and support BTC/USD, while stronger employment conditions could favor the dollar. Import Price Index, Business Inventories, and mortgage delinquency data may also affect sentiment by shaping inflation, growth, and housing-market expectations. In addition, speeches from Federal Reserve officials Jeffrey Schmid, Beth Hammack, and John Williams could create volatility if their comments provide hawkish or dovish clues about interest rates.
BTC USD Technical Analysis
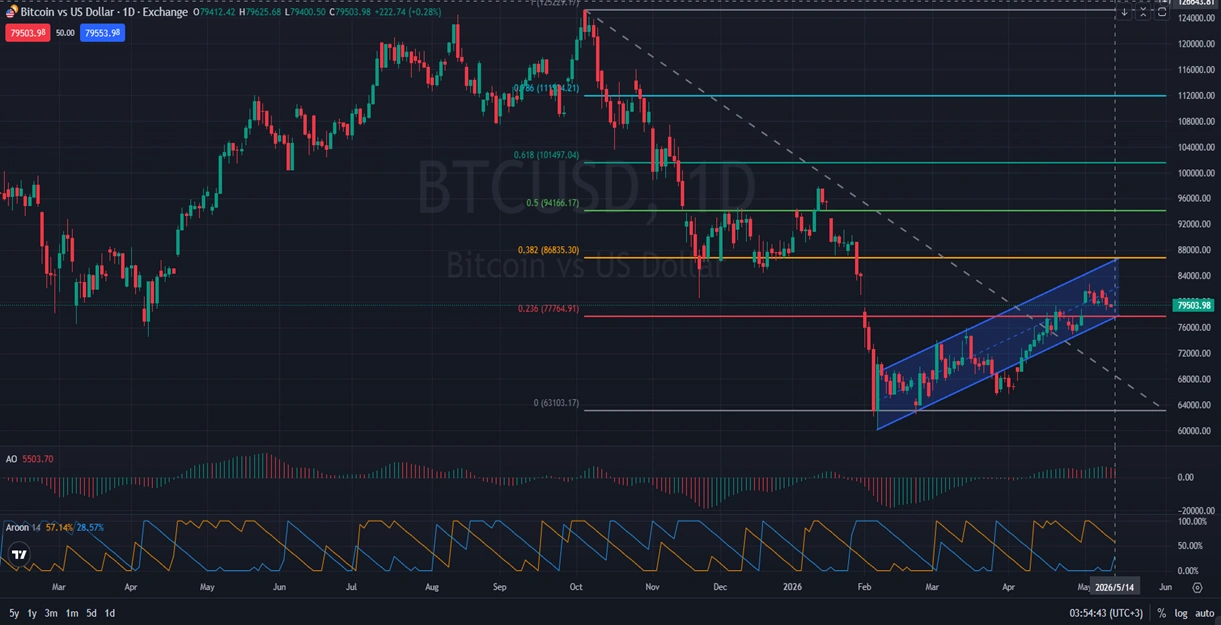
On the daily timeframe, BTC/USD is recovering inside a bullish channel after a dramatic selloff, showing that buyers are gradually trying to regain control. Current candles are trading in the lower section of the rising channel, which means the recovery is still developing and has not yet shown full strength. Price is moving near the channel trendline and the Fibonacci retracement level 0.236 around 77,764.91, making this area an important support and decision zone. Even if the previous sharp bearish trend attempts to resume, BTC/USD could still push toward the Fibonacci 0.382 level around 86,835.30 before facing stronger selling pressure. The Awesome Oscillator at 5503.70 supports improving bullish momentum, while the Aroon indicator at 57.14% and 28.57% shows buyers currently have a moderate advantage. A clean move above the current channel resistance could strengthen the bullish recovery, while a break below the channel support may return pressure toward lower levels.
Final words about BTC vs USD
BTC/USD is showing early signs of recovery, but the pair has not fully escaped the impact of the previous bearish decline. The bullish channel structure gives buyers a technical base, yet price must remain above the lower trendline to keep the recovery valid. US retail sales, jobless claims, import prices, and Federal Reserve speeches could strongly influence Bitcoin through changes in dollar strength and risk appetite. A move toward the 0.382 Fibonacci level would support a stronger short-term recovery outlook, while failure near the 0.236 area may expose BTC/USD to renewed selling. For now, BTC/USD daily analysis supports cautious optimism, with traders watching both the rising channel and US macroeconomic signals for confirmation.
Disclaimer: This BTCUSD analysis, provided by Unitedpips, is for informational purposes only and does not constitute trading advice. Always conduct your own Forex analysis before making any trading decisions.
Related Posts

EURGBP Price Action Holds Bearish Consolidation
Introduction to EUR-GBPThe EUR-GBP pair shows the exchange rate between the Euro and the British…
NZD/USD Forecast: Consolidation Before Major Move
Introduction to NZDUSDThe NZD USD pair, commonly known as the “Kiwi”, represents the exchange rate…
Gold Outlook: US Inflation Data In Focus
Introduction to Gold/USDThe XAU/USD pair represents the value of Gold against the US Dollar and…