Ripple Struggles Below Major Breakout Zone

Introduction to XRP/USD
The XRP/USD pair shows the exchange rate between Ripple’s XRP token and the US dollar. XRP is often connected with fast cross-border payment solutions, making it one of the most watched major cryptocurrencies. This pair is important for traders because it reflects both crypto market sentiment and US dollar strength. XRPUSD is commonly traded by investors looking for volatility, liquidity, and technical breakout opportunities.
XRP-USD Market Overview
XRP-USD is currently moving with a cautious tone as the broader market remains influenced by US dollar news, Federal Reserve commentary, inflation data, and employment indicators. The US dollar may receive support if Federal Reserve speakers, including John Williams and Austan Goolsbee, sound more hawkish on monetary policy. Traders are also watching CPI and Core CPI data, as stronger inflation readings could increase expectations for higher interest rates and strengthen the dollar against Ripple. Employment data from ADP and small business sentiment from NFIB may also affect market confidence and risk appetite. For XRP, this means price action may remain sensitive to both crypto sentiment and macroeconomic pressure from the USD side. Until stronger bullish momentum appears, XRP-USD daily analysis suggests that traders may continue to focus on resistance zones and the wider bearish structure.
XRP USD Technical Analysis
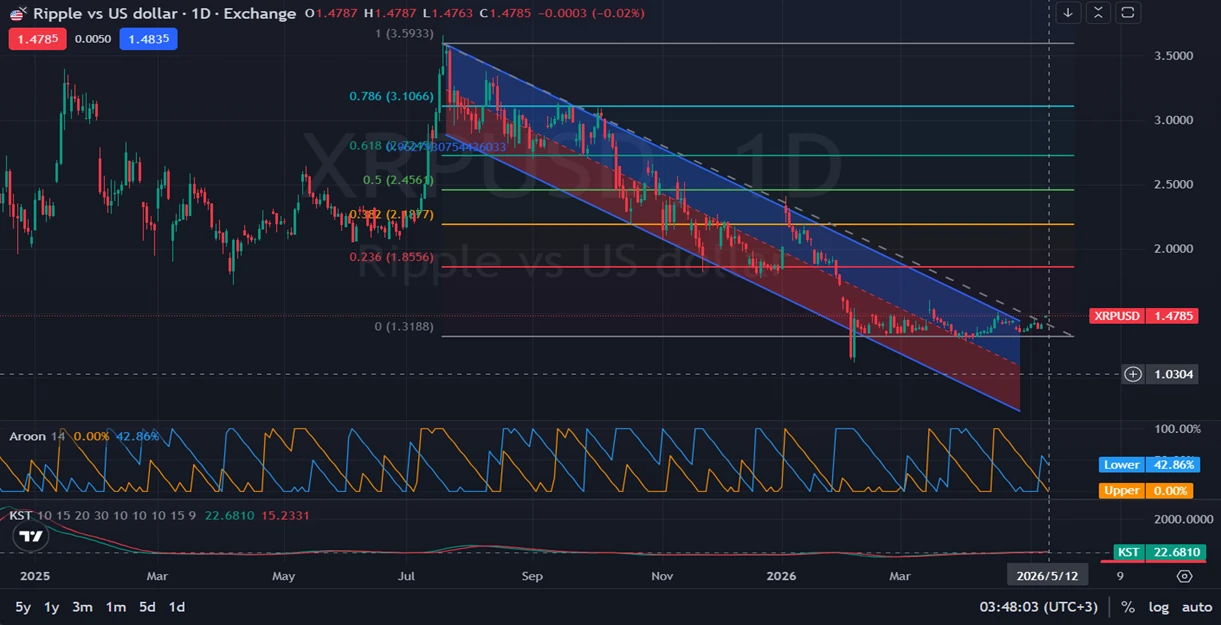
Looking at the daily chart of XRP/USD, the pair is still trading inside a descending price channel, showing that the broader XRP price trend remains under pressure. Price is consolidating near the channel resistance around 1.50, while the recent candles look small and indecisive, suggesting weak bullish recovery without a confirmed breakout. Fibonacci levels show that XRP/USD is trading near the lower 0% area around 1.50, with the first major resistance near 1.85 at the 23.6% Fibonacci retracement. A stronger recovery could target 2.14 at the 38.2% Fibonacci level, while key support remains at 1.31 followed by 1.03. The Aroon indicator still reflects weak trend strength and bearish pressure, with the Upper line at 0% and the Lower line near 42.86%. The KST indicator is slightly improving, but it remains weak, meaning momentum has not yet confirmed a bullish reversal. Overall, as long as XRP/USD remains below 1.50–1.55, the daily bias stays bearish-to-sideways, while a clean breakout above this zone may open the door toward 1.85.
Final words about XRP vs USD
XRP/USD remains at an important technical point as price tests resistance inside a larger descending channel. The pair needs a clear daily close above 1.50–1.55 to confirm that buyers are gaining control. Without that breakout, Ripple may continue to trade sideways or return toward support around 1.31. US dollar strength from inflation data, Federal Reserve comments, and employment indicators could also limit XRP upside in the short term. Traders should watch the 1.50 resistance zone, the 1.31 support level, and the momentum indicators for confirmation before making strong directional decisions. Risk management remains essential because XRP/USD can react sharply to both crypto news and macroeconomic events.
Disclaimer: This XRPUSD analysis, provided by Unitedpips, is for informational purposes only and does not constitute trading advice. Always conduct your own Forex analysis before making any trading decisions.
Related Posts

EURGBP Price Action Holds Bearish Consolidation
Introduction to EUR-GBPThe EUR-GBP pair shows the exchange rate between the Euro and the British…
NZD/USD Forecast: Consolidation Before Major Move
Introduction to NZDUSDThe NZD USD pair, commonly known as the “Kiwi”, represents the exchange rate…
Gold Outlook: US Inflation Data In Focus
Introduction to Gold/USDThe XAU/USD pair represents the value of Gold against the US Dollar and…