EUR/USD Daily Forecast: Traders Watch Resistance Zone

Introduction to EUR USD
The EURUSD pair, commonly known as the Fiber, is the most traded currency pair in the global forex market. It represents the exchange rate between the euro and the US dollar, two of the world’s most influential reserve currencies. EUR/USD is highly sensitive to inflation data, central bank policy decisions, bond yields, and economic growth expectations. Because of its liquidity and volatility, EUR/USD remains one of the most important instruments for traders focusing on daily forex analysis and macroeconomic trading strategies.
EURUSD Market Overview
EUR/USD continues to trade within a broader bullish structure, although recent price action reflects increasing hesitation near key resistance levels. On the euro side, traders are closely monitoring German Wholesale Price Index data, French CPI figures, Eurozone GDP revisions, Industrial Production, and comments from ECB President Christine Lagarde. Any hawkish signals from Lagarde or stronger-than-expected inflation and growth data could support the euro by reinforcing expectations for tighter European Central Bank policy. On the US dollar side, investors are focused on Core PPI, PPI inflation data, Treasury bond auction results, and speeches from Federal Reserve officials Susan Collins and Neel Kashkari. Markets are also paying attention to the US Senate vote regarding Kevin Warsh’s nomination as Federal Reserve Chair, as any shift in expectations around future Fed leadership could influence the US dollar and broader market sentiment.
EUR/USD Technical Analysis
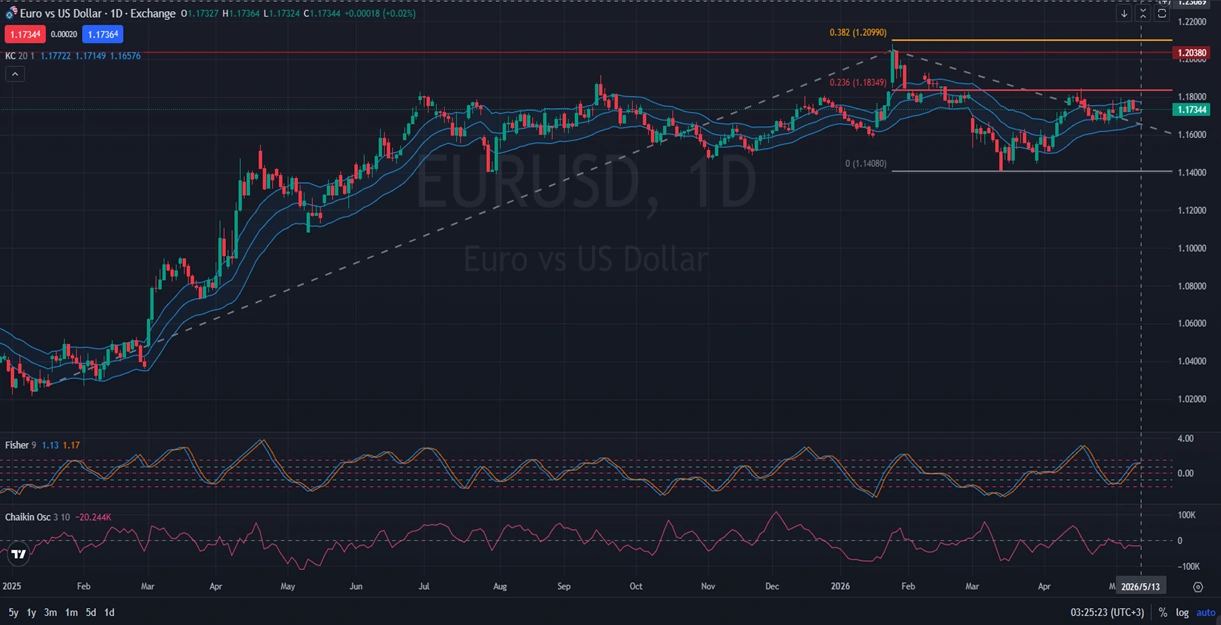
On the daily timeframe, EUR USD continues to move within a broader bullish trend, despite experiencing several corrective phases along the way. After reaching the major resistance level at 1.20380, the pair pulled back and is now struggling near the Fibonacci extension level 0.236 around 1.18349, which appears to be acting as an important resistance barrier. Current price action shows consolidation near the middle of the recent range, suggesting that traders remain cautious while waiting for stronger momentum confirmation. The Keltner Channel levels at 1.17722, 1.17149, and 1.16576 indicate that EUR/USD is trading near the upper-middle region of the volatility range, maintaining a mildly bullish structure. Meanwhile, the Fisher indicator at 1.13 and 1.17 continues to support bullish momentum, although the Chaikin Oscillator at -20.244K signals weaker buying pressure in the short term. If EUR/USD successfully breaks above the Fibonacci resistance and historical barrier near 1.18349, the broader bullish trend could continue toward higher levels.
Final words about EUR vs USD
EUR/USD still maintains a bullish outlook on the daily chart, but recent price action suggests that buyers are facing stronger resistance pressure near key technical levels. The pair remains supported by the broader uptrend, although momentum indicators show signs of slowing. Fundamentally, upcoming Eurozone inflation and growth data, along with Federal Reserve commentary and US inflation releases, could become major catalysts for volatility. A confirmed breakout above resistance would strengthen bullish sentiment and potentially open the path toward retesting higher levels, while failure to break higher may trigger a consolidation phase or temporary pullback. For now, EUR/USD daily analysis supports a cautiously bullish outlook as traders monitor both technical resistance and macroeconomic developments.
Disclaimer: This EURUSD analysis, provided by Unitedpips, is for informational purposes only and does not constitute trading advice. Always conduct your own Forex analysis before making any trading decisions.
Related Posts

EURGBP Price Action Holds Bearish Consolidation
Introduction to EUR-GBPThe EUR-GBP pair shows the exchange rate between the Euro and the British…
NZD/USD Forecast: Consolidation Before Major Move
Introduction to NZDUSDThe NZD USD pair, commonly known as the “Kiwi”, represents the exchange rate…
Gold Outlook: US Inflation Data In Focus
Introduction to Gold/USDThe XAU/USD pair represents the value of Gold against the US Dollar and…