Gold Technical Analysis Shows Consolidation Before Breakout

Introduction to XAUUSD
Gold (XAU/USD), often referred to as the ultimate safe-haven asset, remains one of the most actively traded instruments in global financial markets. Traders closely follow Gold against the US dollar because it reflects inflation expectations, interest rate outlooks, and overall market uncertainty. Gold prices are highly sensitive to Federal Reserve policy, US economic data, and geopolitical developments. This makes Gold a key asset for investors focusing on daily market analysis, inflation hedging, and long-term wealth preservation strategies.
XAU/USD Market Overview
Gold continues to trade in a broadly bullish environment, although recent price action reflects growing consolidation near key technical levels. On the US dollar side, traders are monitoring inflation expectations data from the Federal Reserve Bank of Cleveland, as rising inflation expectations could strengthen the case for tighter monetary policy and potentially support the US dollar. At the same time, Existing Home Sales data remains important because stronger housing activity may signal resilience in the US economy, which can also influence Federal Reserve expectations. However, Gold continues to receive support from broader uncertainty surrounding inflation trends and interest rate direction. In the near term, Gold prices are likely to remain sensitive to incoming US economic data and shifts in market expectations regarding inflation and monetary policy.
XAU USD Technical Analysis
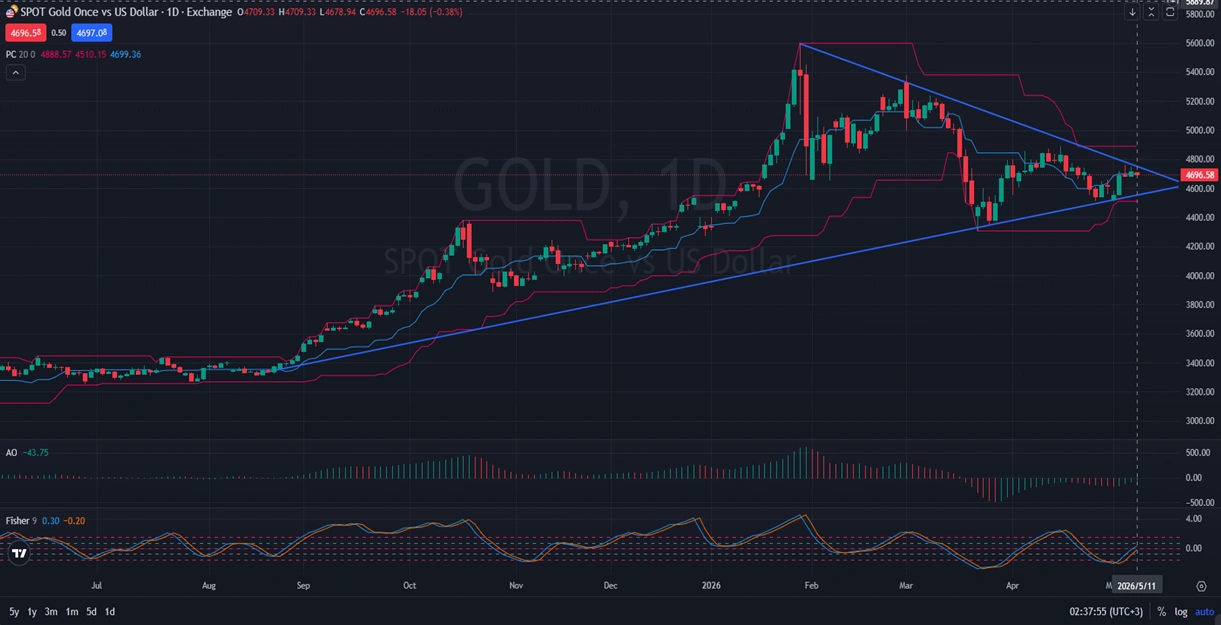
On the daily timeframe, XAUUSD appears to be forming a classic bullish pennant pattern, with candles creating a structure of lower highs and higher lows following the previous strong bullish rally. This pattern often signals temporary consolidation before a continuation of the dominant trend. Currently, price action has moved close to the apex of the triangle, suggesting that a breakout phase may be approaching. The Price Channel levels at 4888.57, 4510.15, and 4699.36 indicate that Gold is trading near the midpoint of its broader range while maintaining underlying bullish structure. Meanwhile, the Awesome Oscillator at -43.75 reflects weaker short-term momentum, although the Fisher indicator at 0.30 and -0.20 suggests that bullish momentum may slowly be attempting to recover. If Gold breaks above the upper trendline of the pennant, the broader bullish trend could continue with stronger upside momentum.
Final words about Gold
Gold remains technically bullish on the daily chart despite the recent consolidation phase. The formation of a bullish pennant pattern suggests that the market may simply be pausing before its next directional move. However, traders should remain cautious because US inflation expectations and economic data could still strengthen the US dollar and pressure Gold in the short term. A confirmed breakout above the pennant resistance would likely reinforce bullish sentiment, while failure to break higher could lead to further sideways movement. For now, Gold daily analysis favors a cautiously bullish outlook, with traders watching closely for breakout confirmation and stronger momentum signals.
Disclaimer: This XAUUSD analysis, provided by Unitedpips, is for informational purposes only and does not constitute trading advice. Always conduct your own Forex analysis before making any trading decisions.
Related Posts

EURGBP Price Action Holds Bearish Consolidation
Introduction to EUR-GBPThe EUR-GBP pair shows the exchange rate between the Euro and the British…
NZD/USD Forecast: Consolidation Before Major Move
Introduction to NZDUSDThe NZD USD pair, commonly known as the “Kiwi”, represents the exchange rate…
Gold Outlook: US Inflation Data In Focus
Introduction to Gold/USDThe XAU/USD pair represents the value of Gold against the US Dollar and…