Bitcoin Daily Chart: Keltner Confirms Downtrend

Introduction to BTC/USD
The BTC USD pair tracks the value of Bitcoin priced in US dollars, making it one of the most watched benchmarks in crypto trading and risk sentiment. Bitcoin is often called “digital gold” due to its fixed supply narrative, while the US dollar is widely known as the “greenback,” the world’s primary reserve currency. Because BTC/USD blends crypto volatility with USD macro drivers, it frequently reacts to both technical levels and US economic releases. For traders and investors, BTC/USD daily analysis helps identify trend direction, key breakout zones, and high-probability support and resistance areas.
BTCUSD Market Overview
BTC/USD remains broadly bearish on the daily chart, reflecting cautious risk appetite and steady focus on US macro catalysts. Traders are watching the ADP employment report, which often shapes near-term USD expectations and can influence Bitcoin flows through the “strong dollar vs risk assets” channel. Next, S&P Global Services PMI and the ISM Services (Non-Manufacturing) PMI will provide fresh clues on business activity and demand—data that can move yields, the dollar, and crypto sentiment. EIA crude oil inventories can also affect inflation expectations and broader market mood, indirectly feeding into BTC/USD volatility. Looking ahead, the Federal Reserve Beige Book may shift rate expectations if its tone is more hawkish or more cautious than markets expect.
BTC USD Technical Analysis
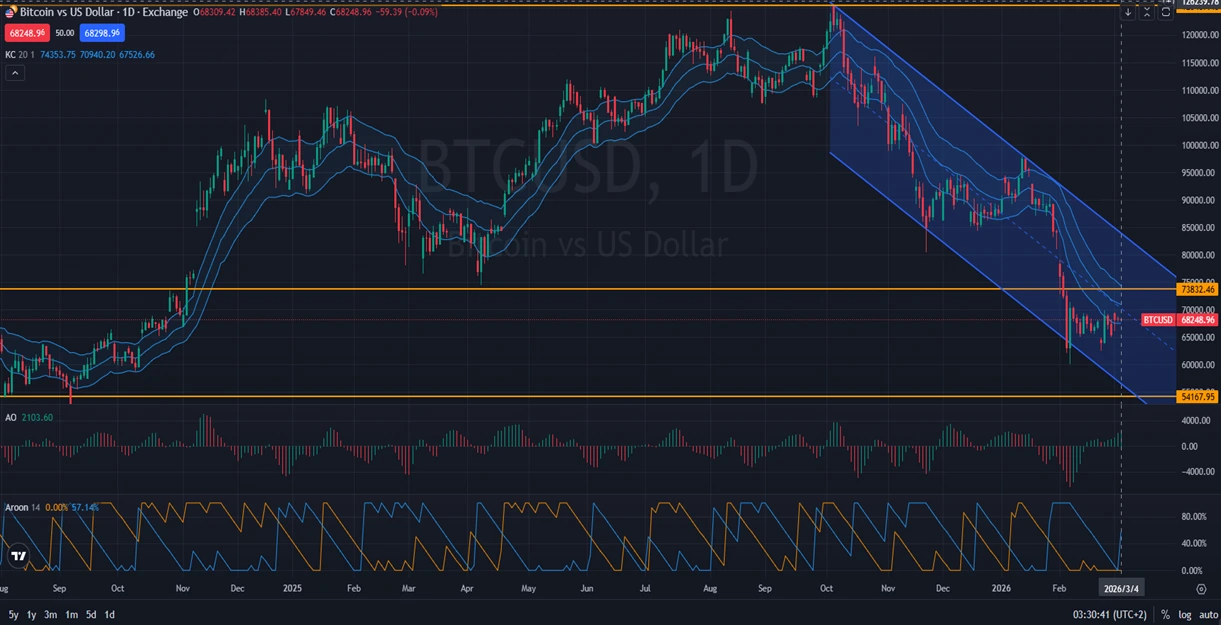
After peaking near 125,437.40, BTCUSD fell sharply within a bearish channel, confirming a dominant downtrend. Price is now trading inside a major reaction zone between 54,167.95 and 73,832.46, where the market previously showed strong responses. A clean move below this zone would likely turn it into strong resistance, supporting continuation lower along the channel. The Keltner Channel (74,353.75 / 70,940.20 / 67,526.66) shows price leaning toward the lower band, consistent with ongoing downside pressure. Accelerator Oscillator: 2,103.60 hints at improving momentum versus prior lows, but structure remains bearish. Aroon (0.00% vs 57.14%) also signals weak upside trend strength, keeping sellers in control unless a breakout occurs.
Final Words on BTC vs USD
BTC/USD is at a decisive area where daily closes matter more than intraday noise. As long as the pair holds within the downward channel, rebounds may remain corrective unless buyers reclaim the upper part of the 54,167.95–73,832.46 zone. Upcoming US data—especially ADP and services PMIs, plus the Beige Book—could be the catalyst for the next expansion in volatility. If the zone fails, downside continuation becomes more likely; if it holds, a technical bounce can develop. Keep risk tight, because Bitcoin’s reaction to USD shifts can be fast and sharp.
Disclaimer: This BTCUSD analysis, provided by Unitedpips, is for informational purposes only and does not constitute trading advice. Always conduct your own Forex analysis before making any trading decisions.
Related Posts

EURGBP Price Action Holds Bearish Consolidation
Introduction to EUR-GBPThe EUR-GBP pair shows the exchange rate between the Euro and the British…
NZD/USD Forecast: Consolidation Before Major Move
Introduction to NZDUSDThe NZD USD pair, commonly known as the “Kiwi”, represents the exchange rate…
Gold Outlook: US Inflation Data In Focus
Introduction to Gold/USDThe XAU/USD pair represents the value of Gold against the US Dollar and…