GOLD Price Forecast: XAU/USD Near Major Breakout Today

Introduction to GOLD /USD
The Gold/US Dollar pair, widely known as XAU/USD, tracks the value of gold against the US dollar and remains one of the most followed instruments in the global financial markets. Traders often refer to gold as the yellow metal and a classic safe-haven asset, especially during periods of geopolitical tension and economic uncertainty. Because the US dollar is the pricing benchmark for gold worldwide, movements in US data, Federal Reserve expectations, and global risk sentiment can strongly influence this pair. For traders looking for a Gold price forecast, GOLD-USD daily analysis is especially important when the market is near major technical breakout zones.
GOLD/USD Market Overview
The broader trend in Gold vs US Dollar remains bullish from a medium-term perspective, but the current Gold/USD daily chart shows that price action has shifted into a consolidation phase after a powerful rally to the recent all-time high area near 5600. In the last two days, market attention has been heavily focused on geopolitical headlines involving the United States, Iran, and the Strait of Hormuz, and those developments have kept safe-haven demand for gold supported while also increasing volatility in oil and broader commodity markets. At the same time, the US dollar side of the equation is being shaped by several important macro themes, including US employment data from ADP, consumer spending indicators such as Retail Sales and Core Retail Sales, housing data, and speeches from Federal Reserve officials including Kevin Warsh and Christopher Waller. For the current day and the next trading session, traders are likely to watch whether US data strengthens the dollar through a more hawkish monetary-policy outlook or whether geopolitical risk continues to favor gold buying. This creates a mixed but highly tradeable environment for Gold price analysis, where both safe-haven flows and dollar strength are competing for control. If ceasefire tensions worsen or the Hormuz situation escalates, gold may attract renewed defensive demand, while stronger US figures or hawkish Fed signals could temporarily cap upside momentum in XAU/USD.
GOLD-USD Technical Analysis
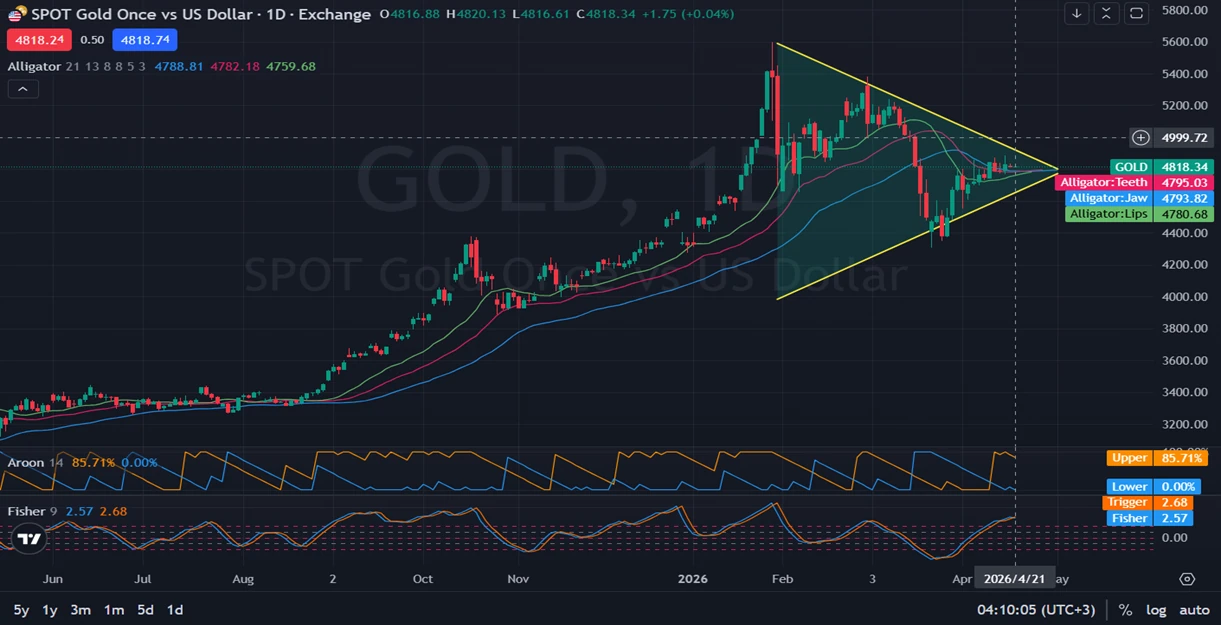
Looking at the daily chart of Gold-US Dollar, price is moving inside a large symmetrical triangle, or a disjoint consolidation channel, formed after the sharp surge to the all-time high near 5600 and the later pullback toward the 4300 region. The current price around 4800–4818 places gold close to the middle-to-upper area of this compression structure, which suggests the market is preparing for a decisive directional move but has not confirmed it yet. The Alligator indicator shows strong compression, with the lines clustered tightly together: the red line is currently on top, the blue line sits just below it, and the green line is underneath while trying to turn upward. This kind of structure usually reflects a market that is transitioning from consolidation toward a breakout attempt, but confirmation is still needed through a daily close above triangle resistance or below triangle support. The Aroon 14 reading at 85.71 for Aroon Up and 0.00 for Aroon Down signals that bullish pressure has recently regained some control, even though the trend is not fully released yet. Meanwhile, the Fisher 9 reading near 2.57 versus the Trigger at 2.68 suggests momentum remains elevated but is not yet giving a clean acceleration signal, which fits the idea of a market pausing before a larger move. From a price-action perspective, the key resistance zone is the upper boundary of the triangle and then the psychological 5000 region, while support is found near the clustered Alligator levels around 4795–4780, followed by deeper structural support toward the lower triangle boundary.
Final words about GOLD vs USD
Overall, the Gold vs US Dollar daily analysis points to a market that is still structurally strong but temporarily trapped in a high-stakes consolidation pattern. Gold is being supported by geopolitical uncertainty and safe-haven demand, yet the US dollar remains capable of pushing back if incoming US economic data beats expectations or if Federal Reserve speakers sound more hawkish. That means the next 24 hours could be especially important, not only for XAU/USD forecast direction but also for confirming whether the current triangle resolves upward or downward. Traders should pay close attention to both headline risk and the technical breakout levels, because gold often reacts sharply when macro news and chart structure align at the same time. A sustained break above resistance would strengthen the bullish case for another leg higher, while a rejection from the upper boundary could send price back into deeper consolidation before the next major move develops.
Disclaimer: This XAUUSD analysis, provided by Unitedpips, is for informational purposes only and does not constitute trading advice. Always conduct your own Forex analysis before making any trading decisions.
Related Posts

EURGBP Price Action Holds Bearish Consolidation
Introduction to EUR-GBPThe EUR-GBP pair shows the exchange rate between the Euro and the British…
NZD/USD Forecast: Consolidation Before Major Move
Introduction to NZDUSDThe NZD USD pair, commonly known as the “Kiwi”, represents the exchange rate…
Gold Outlook: US Inflation Data In Focus
Introduction to Gold/USDThe XAU/USD pair represents the value of Gold against the US Dollar and…