GBP/USD Technical and Fundamental Daily Analysis

Introduction to GBP/USD
The GBP/USD currency pair, representing the exchange rate between the British Pound and the U.S. Dollar, is a key barometer for trade and economic sentiment between the United Kingdom and the United States. This currency pair, also known as “Cable,” is highly volatile and influenced by numerous factors including political events, economic data, and market sentiment. Currently, significant economic updates from both the UK and the US are expected to play a major role in determining the direction of this pair.
GBP/USD Daily Market Overview
The GBP/USD pair has recently shown signs of bullish momentum, breaking through a crucial resistance level and now forming higher highs and higher lows. This shift comes amidst a background of stable UK interest rates and potential adjustments in the US Federal Funds Rate. The MACD indicator on the daily chart points to a potential bullish wave, while the RSI indicates the pair has undergone a correction but remains above the midline, suggesting continued bullish potential.
GBP/USD Technical Analysis
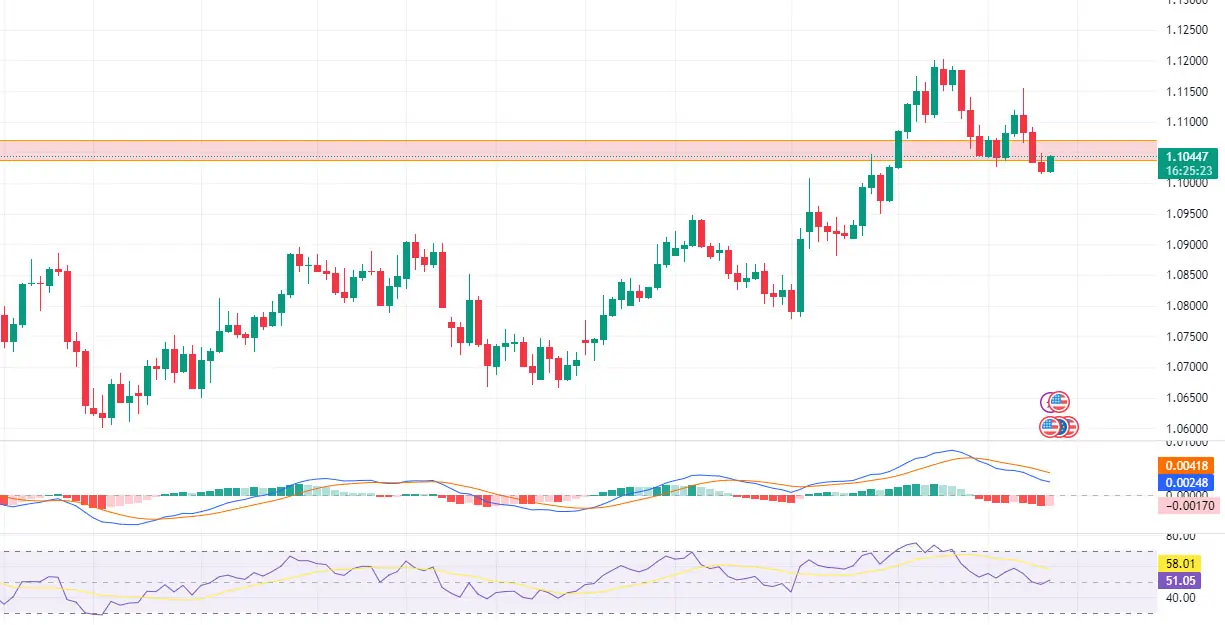
From a technical perspective, the daily chart of GBP/USD shows that the pair has successfully breached a key resistance level, now potentially serving as support around the 1.3000 mark. This could act as a foundation for further advances if the current trajectory is maintained, underpinned by the formation of higher highs and lower lows—a hallmark of an emerging bullish trend. The MACD indicator underscores increasing bullish momentum, hinting that the upward movement may persist. Additionally, the RSI, positioned above 50 yet shy of the overbought territory, suggests there is scope for further upward movement without the imminent risk of a reversal.
Final Thoughts on GBP/USD Daily Chart
With the GBP/USD pair currently above a pivotal level and upcoming economic data from both the UK and the US, the next few sessions are likely to be crucial. The stability of UK rates combined with potential changes in US monetary policy could drive significant volatility. Traders should closely monitor the 1.3000 level for potential support and watch for economic updates that could sway market sentiment significantly. A break above current resistance could confirm continuation of the bullish trend, while a retreat below support might suggest a reevaluation of the bullish outlook.
Related Posts

EURGBP Price Action Holds Bearish Consolidation
Introduction to EUR-GBPThe EUR-GBP pair shows the exchange rate between the Euro and the British…
NZD/USD Forecast: Consolidation Before Major Move
Introduction to NZDUSDThe NZD USD pair, commonly known as the “Kiwi”, represents the exchange rate…
Gold Outlook: US Inflation Data In Focus
Introduction to Gold/USDThe XAU/USD pair represents the value of Gold against the US Dollar and…