USD/CAD Daily Analysis: Technical and Fundamental Outlook

Introduction to USD-CAD
The USDCAD currency pair, often nicknamed the “Swissie,” represents the exchange rate between the US Dollar and the Swiss Franc. This pairing is widely traded by forex traders due to its reputation as a safe haven during economic uncertainty. The Swiss Franc is highly influenced by economic conditions in Switzerland, while the US Dollar is sensitive to US economic data and monetary policy decisions. Understanding the behavior of USD/CAD helps traders capitalize on trends and volatility in global financial markets.
USDCAD Market Overview
USDCAD is experiencing notable volatility driven by a series of important economic releases and central bank communications from both the US and Canada. Earlier today, the US reported an ADP Non-Farm Employment Change of 111K, significantly surpassing expectations, which provided support to the dollar. Meanwhile, Canada’s Labor Productivity growth came in weaker than forecast at 0.2% versus 0.6%, adding some pressure on the Canadian dollar. Market focus is sharply on the Bank of Canada’s rate statement and the accompanying press conference, with the overnight rate held steady at 2.75%, maintaining a cautious stance. On the US side, speeches by FOMC members Bostic and Cook, along with the final Services PMI and ISM Services PMI figures, suggest steady but moderate expansion in the US service sector, underpinning the greenback. Additional attention is on US crude oil inventories data and the upcoming Beige Book, which could further influence market sentiment. Overall, traders should prepare for heightened fluctuations in USDCAD as these economic indicators and central bank insights unfold.
USD/CAD Technical Analysis
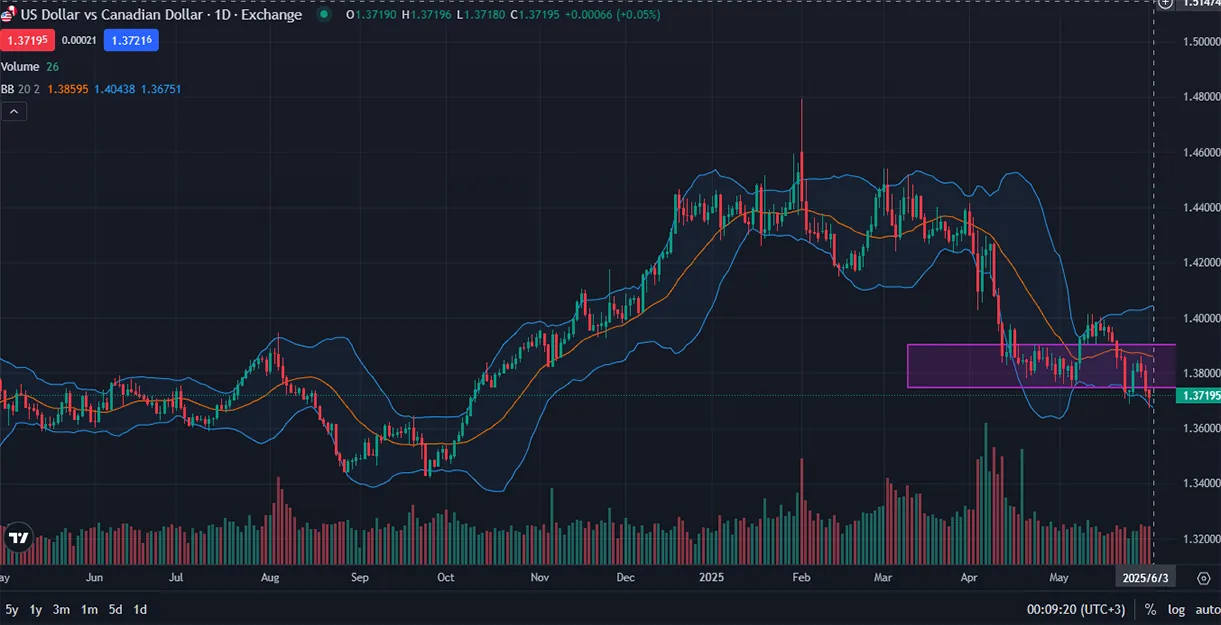
Technically, the USD-CAD pair has experienced a sharp downturn followed by a partial recovery. After encountering strong resistance around the 0.83688 level, the price retraced downward and currently tests an H4 support line. Should the support hold and price rebound, immediate resistance at 0.83688 would be the next significant target, followed by the descending trend resistance line. Conversely, if the H4 support line breaks, the price may decline further toward the longer-term trend support line. The Parabolic SAR indicator currently shows bearish sentiment, the Fisher oscillator is negative, indicating selling pressure, and the Stochastic RSI suggests a potential reversal upwards in the short term due to oversold conditions.
Final Words about USD vs CAD
In conclusion, the USD CAD pair is navigating through critical technical and fundamental junctures. Traders should closely watch the upcoming economic data releases and central bank speeches to gauge market direction. Given the current mixed signals from indicators and price action, prudent risk management and flexibility in trading strategies are advised. Monitoring the identified resistance and support levels will be crucial for deciding entry and exit points in the coming sessions.
Related Posts

EURGBP Price Action Holds Bearish Consolidation
Introduction to EUR-GBPThe EUR-GBP pair shows the exchange rate between the Euro and the British…
NZD/USD Forecast: Consolidation Before Major Move
Introduction to NZDUSDThe NZD USD pair, commonly known as the “Kiwi”, represents the exchange rate…
Gold Outlook: US Inflation Data In Focus
Introduction to Gold/USDThe XAU/USD pair represents the value of Gold against the US Dollar and…