USD/CHF Daily Analysis: Technical Indicators and Fundamental Outlook

Introduction to USD-CHF
The USDCHF currency pair, often nicknamed the “Swissie,” represents the exchange rate between the US Dollar and the Swiss Franc. This pairing is widely traded by forex traders due to its reputation as a safe haven during economic uncertainty. The Swiss Franc is highly influenced by economic conditions in Switzerland, while the US Dollar is sensitive to US economic data and monetary policy decisions. Understanding the behavior of USD/CHF helps traders capitalize on trends and volatility in global financial markets.
USDCHF Market Overview
USD CHF currently faces volatility influenced by key economic announcements from both the US and Switzerland. Recent events include speeches by prominent Federal Reserve members, such as Jerome Powell, Christopher Waller, Austan Goolsbee, and Lorie Logan, who have indicated continued monitoring of inflation and monetary policy strategies, potentially hinting at more hawkish moves to manage economic growth and inflation. Furthermore, manufacturing PMI data from S&P Global and ISM suggests moderate industrial activity in the US, slightly bolstering the dollar. On the Swiss side, upcoming retail sales data and PMI readings may also influence the Swiss Franc by indicating the health of consumer spending and economic activity. Overall, traders should expect heightened volatility due to the interplay of these economic indicators and central bank communications.
USD/CHF Technical Analysis
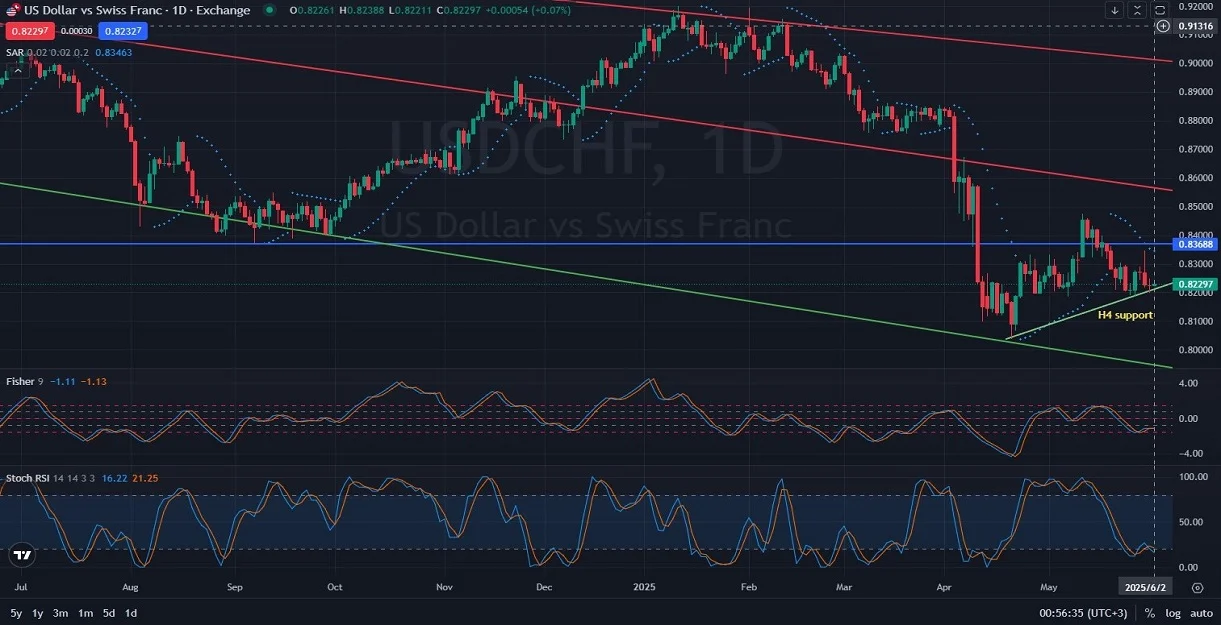
Technically, the USD-CHF pair has experienced a sharp downturn followed by a partial recovery. After encountering strong resistance around the 0.83688 level, the price retraced downward and currently tests an H4 support line. Should the support hold and price rebound, immediate resistance at 0.83688 would be the next significant target, followed by the descending trend resistance line. Conversely, if the H4 support line breaks, the price may decline further toward the longer-term trend support line. The Parabolic SAR indicator currently shows bearish sentiment, the Fisher oscillator is negative, indicating selling pressure, and the Stochastic RSI suggests a potential reversal upwards in the short term due to oversold conditions.
Final Words about USD vs CHF
In conclusion, the USD CHF pair is navigating through critical technical and fundamental junctures. Traders should closely watch the upcoming economic data releases and central bank speeches to gauge market direction. Given the current mixed signals from indicators and price action, prudent risk management and flexibility in trading strategies are advised. Monitoring the identified resistance and support levels will be crucial for deciding entry and exit points in the coming sessions.
Related Posts

EURGBP Price Action Holds Bearish Consolidation
Introduction to EUR-GBPThe EUR-GBP pair shows the exchange rate between the Euro and the British…
NZD/USD Forecast: Consolidation Before Major Move
Introduction to NZDUSDThe NZD USD pair, commonly known as the “Kiwi”, represents the exchange rate…
Gold Outlook: US Inflation Data In Focus
Introduction to Gold/USDThe XAU/USD pair represents the value of Gold against the US Dollar and…