GOLD Trading Insights and Key Levels Today

Introduction to GOLD/USD
The GOLD/USD pair, often referred to simply as “Gold” or “XAUUSD,” represents the value of one ounce of gold in US dollars. It is a critical benchmark for precious metal trading and is influenced by a variety of global economic, political, and financial factors. Traders and investors use XAU/USD to hedge against inflation, currency volatility, and economic uncertainties, making it one of the most actively monitored instruments.
GOLDUSD Market Overview
The Gold continues to trend upward in the face of heightened global uncertainty and mixed US economic data. Today’s focus is on the US Retail Sales data, which is expected to provide a clear indication of consumer spending trends, potentially impacting the USD. With the Federal Reserve’s recent hawkish signals and upcoming comments from New York Fed President John Williams, the USD’s strength might see fluctuations, impacting gold’s price. As the dollar stabilizes, gold has maintained its bullish momentum, benefiting from its safe-haven appeal. The global economic outlook, influenced by inflation trends and US labor market data, remains critical for GOLD/USD’s trajectory.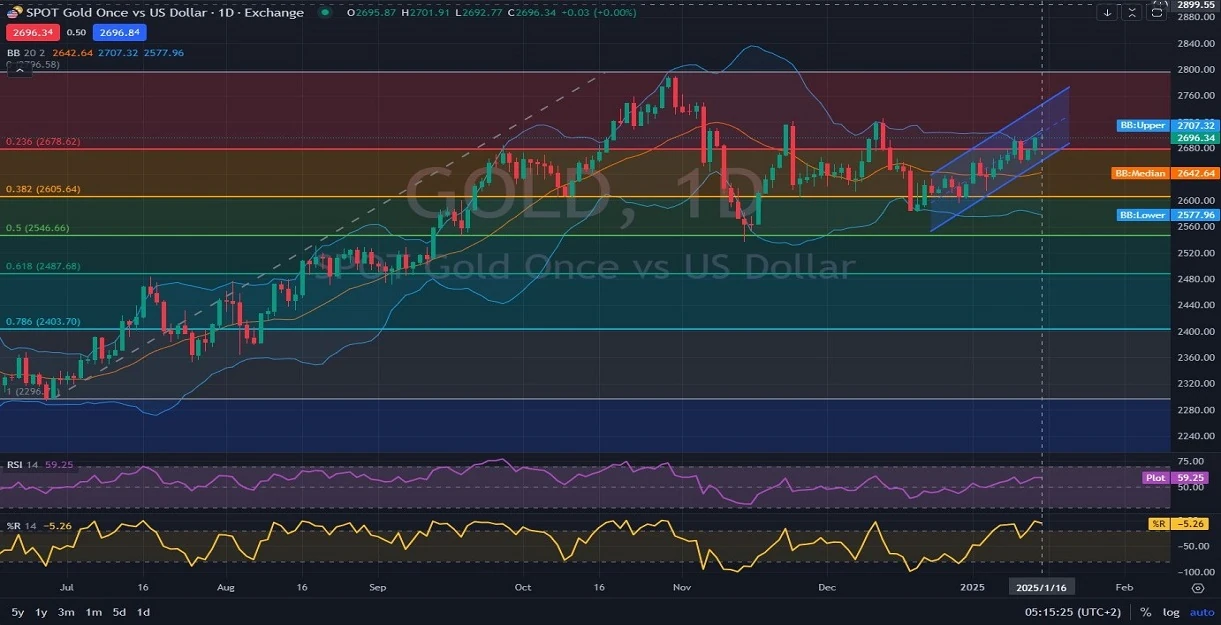
GOLD USD Technical Analysis
The daily chart of GOLD USD shows a bullish trend as the price trades in the upper half of the Bollinger Bands, frequently touching the upper band, signaling strong upward momentum. The price is attempting to break above the 0.236 Fibonacci retracement level at $2,678.62, a critical resistance zone. The Relative Strength Index (RSI) at 59.25 indicates moderate bullish strength, while the Williams %R oscillator suggests that the price is nearing overbought territory. A potential breakout above the current Fibonacci resistance could propel the price toward $2,700, while support remains near the Bollinger Band median at $2,642.64.
Final Words about GOLD vs USD
In conclusion, GOLD-USD is poised for further bullish movement, provided it breaks above the $2,678 resistance. Traders should watch for the US Retail Sales and Jobless Claims data as they will likely influence the USD and indirectly impact gold prices. The combination of technical indicators, including Bollinger Bands and RSI, supports a cautious bullish bias. However, a failure to break key resistance levels could lead to temporary consolidation or retracement. With its safe-haven status intact, gold remains a crucial asset amid global uncertainties.
01.16.2025
Related Posts

EURGBP Price Action Holds Bearish Consolidation
Introduction to EUR-GBPThe EUR-GBP pair shows the exchange rate between the Euro and the British…
NZD/USD Forecast: Consolidation Before Major Move
Introduction to NZDUSDThe NZD USD pair, commonly known as the “Kiwi”, represents the exchange rate…
Gold Outlook: US Inflation Data In Focus
Introduction to Gold/USDThe XAU/USD pair represents the value of Gold against the US Dollar and…