USD-CAD Daily Chart Shows Bullish Momentum

Introduction to USDCAD
The USDCAD pair represents the exchange rate between the US dollar and the Canadian dollar, one of the most actively traded forex pairs. USD/CAD is often nicknamed the “Loonie,” referring to Canada’s one-dollar coin and the Canadian dollar itself. This pair is highly influenced by US labor data, Canadian employment figures, oil prices, and central bank expectations. For traders, USD CAD daily analysis is important because it reflects both US dollar strength and Canadian dollar sentiment.
USD-CAD Market Overview
USD-CAD is currently showing a cautiously bullish tone as traders focus on upcoming US and Canadian labor market data. The US dollar remains supported by key employment indicators such as Non-Farm Payrolls, unemployment rate data, and labor cost measures, all of which can influence Federal Reserve policy expectations. Stronger-than-forecast US jobs or wage data would likely support the US dollar and push USD-CAD higher. On the Canadian dollar side, traders are watching employment change, unemployment rate figures, and the Ivey PMI for signs of economic strength or weakness. Since Canadian employment and business activity data can strongly affect Bank of Canada expectations, any positive surprise could strengthen the Canadian dollar and limit USDCAD upside. Overall, the USD/CAD daily outlook remains sensitive to labor market momentum, inflation expectations, and broader risk sentiment.
USD/CAD Technical Analysis
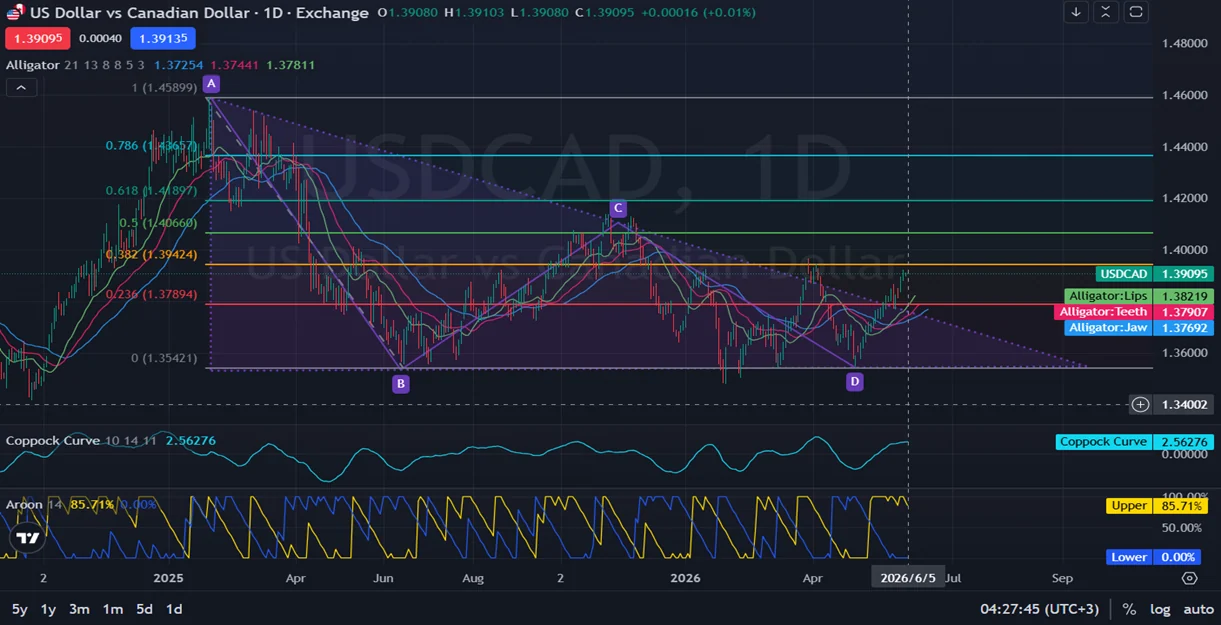
Looking at the USD/CAD daily chart, price action is showing a bullish recovery inside a larger symmetrical triangle pattern. The pair is trading near 1.3900, with immediate support around 1.3790, where the Alligator Teeth and Fibonacci 23.6% level create an important technical confluence. The nearest resistance is located around 1.3950, which aligns with the Fibonacci 38.2% retracement and recent swing resistance. The Alligator indicator is bullishly aligned, with the green Lips above the red Teeth and blue Jaw, suggesting strengthening upward momentum after a long consolidation phase. A sustained breakout above 1.3950 could open the way toward 1.4066, followed by 1.4189. The Coppock Curve is positive and rising at 2.56, supporting improving bullish momentum, while the Aroon indicator shows strong upside pressure with Aroon Up at 85.71% and Aroon Down at 0.00%. However, failure to break resistance could lead USD CAD back toward 1.3790, making this zone a key support area for the daily trend.
Final words about USD vs CAD
USD/CAD remains at an important technical and fundamental turning point. The daily chart favors a bullish breakout attempt, especially while price holds above the 1.3790 support region. A confirmed daily close above 1.3942–1.3950 would strengthen the bullish USD/CAD forecast and may attract further buying toward 1.4066. However, Canadian employment data and Ivey PMI results could support the Canadian dollar if they come in stronger than expected. Traders should closely monitor US labor market data, Canadian economic releases, and the triangle breakout structure before taking directional positions. Overall, USD/CAD daily analysis suggests bullish potential, but confirmation above resistance remains essential.
Disclaimer: This USDCAD analysis, provided by Unitedpips, is for informational purposes only and does not constitute trading advice. Always conduct your own Forex analysis before making any trading decisions.
Related Posts

EURGBP Price Action Holds Bearish Consolidation
Introduction to EUR-GBPThe EUR-GBP pair shows the exchange rate between the Euro and the British…
NZD/USD Forecast: Consolidation Before Major Move
Introduction to NZDUSDThe NZD USD pair, commonly known as the “Kiwi”, represents the exchange rate…
Gold Outlook: US Inflation Data In Focus
Introduction to Gold/USDThe XAU/USD pair represents the value of Gold against the US Dollar and…