BTC/USD Technical Analysis: Bearish Trend Faces Challenge

Introduction to BTCUSD
The BTC USD pair represents the exchange rate between Bitcoin and the US dollar, making it the most widely followed cryptocurrency trading pair in the world. As the benchmark for the digital asset market, Bitcoin often serves as a barometer for overall cryptocurrency sentiment and risk appetite. The pair is heavily influenced by macroeconomic developments, Federal Reserve policy expectations, institutional demand, and broader financial market trends. Monitoring BTC/USD daily price action helps traders identify potential opportunities in both trending and ranging market conditions.
BTC USD Market Overview
BTC/USD remains under pressure as broader market sentiment continues to react to US economic data and Federal Reserve policy expectations. Recent attention has shifted toward upcoming US labor market indicators, including Challenger Job Cut Announcements and Weekly Jobless Claims, which could influence expectations regarding the health of the US economy. Traders are also monitoring speeches from Federal Reserve officials Thomas Barkin and Mary Daly, as any hawkish remarks could strengthen the US dollar and weigh on risk-sensitive assets such as Bitcoin. Additionally, labor productivity and unit labor cost data remain important inflation indicators that could affect future interest rate expectations. Over the next trading sessions, stronger-than-expected US economic releases may support the dollar and create headwinds for Bitcoin, while weaker data could encourage renewed demand for cryptocurrencies and other risk assets.
BTC-USD Technical Analysis
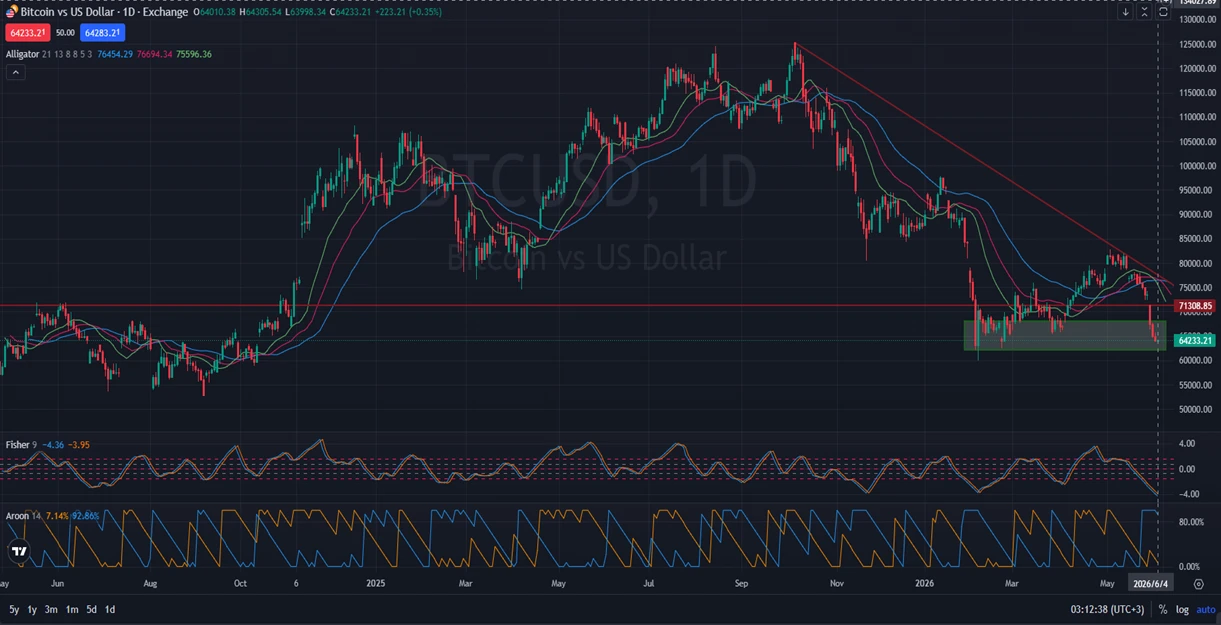
On the daily timeframe, BTCUSD remains within a broader bearish structure after failing to sustain its previous recovery attempt. The price recently declined back toward a major support area that previously prevented further downside movement, and the latest candle suggests that selling pressure may be beginning to weaken. This raises the possibility of a corrective bullish move in the short term. However, buyers previously struggled to overcome the significant resistance level at 71,308.85, making it a critical barrier to monitor if a recovery develops. Should Bitcoin successfully break above this resistance, the descending bearish trendline could become the next major resistance zone. The Williams Alligator indicator (76,454.29, 76,694.34, 75,596.36) continues to reflect bearish conditions as price remains below the indicator averages. Meanwhile, the Fisher indicator (-4.36, -3.95) suggests oversold conditions that could support a corrective bounce, while the Aroon indicator (7.14% Up, 92.86% Down) confirms that bearish momentum remains dominant despite signs of seller exhaustion.
Final words about Bitcoin vs US Dollar
BTC/USD is currently positioned at an important technical crossroads where support and bearish momentum are competing for control. While recent price action indicates that sellers may be losing strength, the broader trend remains bearish until key resistance levels are reclaimed. Traders should closely watch the 71,308.85 resistance area, as a breakout above this level could trigger a stronger recovery toward the descending trendline. At the same time, upcoming US economic releases and Federal Reserve commentary may significantly influence market sentiment and Bitcoin volatility. For now, Bitcoin remains vulnerable to further downside pressure, but the emergence of bullish correction signals suggests that a short-term rebound cannot be ruled out.
Disclaimer: This BTCUSD analysis, provided by Unitedpips, is for informational purposes only and does not constitute trading advice. Always conduct your own Forex analysis before making any trading decisions.
Related Posts

EURGBP Price Action Holds Bearish Consolidation
Introduction to EUR-GBPThe EUR-GBP pair shows the exchange rate between the Euro and the British…
NZD/USD Forecast: Consolidation Before Major Move
Introduction to NZDUSDThe NZD USD pair, commonly known as the “Kiwi”, represents the exchange rate…
Gold Outlook: US Inflation Data In Focus
Introduction to Gold/USDThe XAU/USD pair represents the value of Gold against the US Dollar and…