
Introduction to AUDUSD
The AUD USD pair, commonly known as the “Aussie,” represents the exchange rate between the Australian dollar and the US dollar. It is one of the most actively traded forex pairs due to Australia’s strong commodity-based economy and the global dominance of the US dollar. Traders closely monitor AUD/USD daily analysis because the pair reacts strongly to interest rate expectations, inflation data, commodity demand, and overall market sentiment. As a risk-sensitive currency pair, AUD/USD often reflects broader investor confidence in global economic growth.
AUD-USD Market Overview
AUDUSD has remained in a bullish trend recently as improving market sentiment and stronger demand for risk-related assets continue to support the Australian dollar. On the US dollar side, traders are watching speeches from Federal Reserve officials including Lorie Logan and Lisa Cook, as their comments could provide fresh clues regarding future US interest rate policy. Upcoming US employment and manufacturing-related releases, including the ADP NER Pulse and Richmond Manufacturing Index, may also influence expectations for Federal Reserve monetary policy. Meanwhile, Australian economic attention is focused on upcoming CPI inflation releases and the Melbourne Institute Leading Index, both of which are important indicators for Reserve Bank of Australia policy expectations. Investors are also monitoring comments from RBA Deputy Governor Andrew Hauser, whose statements could affect market expectations around future interest rate adjustments.
AUD USD Technical Analysis
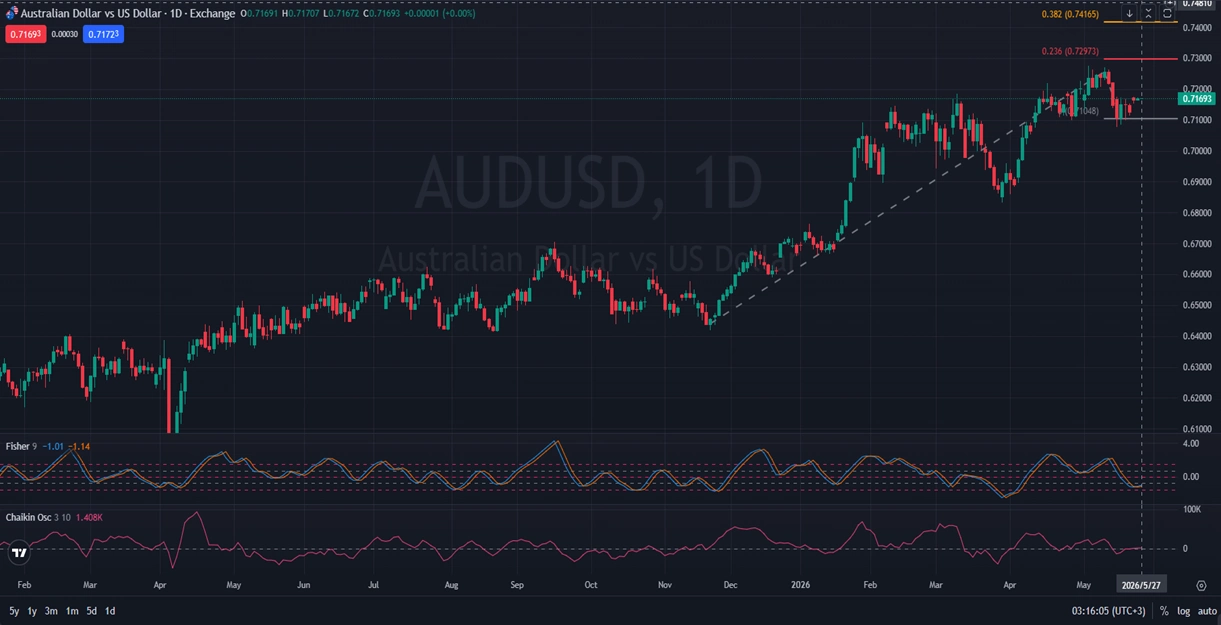
On the daily timeframe, AUD/USD has been climbing steadily for several months, with bullish momentum accelerating significantly during the latest upward phase. The candles initially moved higher at a gradual pace before buyers gained stronger control and pushed the pair upward more aggressively. Recently, however, bullish momentum has started to weaken slightly, suggesting that buyers may be entering a short consolidation phase. Despite this slowdown, the broader bullish structure remains intact as price continues trading above key support zones. According to the Fibonacci expansion levels shown on the chart, the 0.236 level near 0.72973 could become the next major upside target if buyers regain momentum. The Fisher indicator at -1.01 and -1.14 suggests that bearish pressure is easing, while the Chaikin Oscillator reading of 1.408K reflects continued positive money flow into the pair. As long as AUD/USD remains above recent breakout support levels, the bullish outlook could remain dominant.
Final words about AUD vs USD
AUD USD continues to show bullish characteristics on the daily chart despite signs of slowing momentum near current levels. The pair remains supported by positive market sentiment and expectations surrounding Australian inflation and economic activity data. At the same time, upcoming Federal Reserve speeches and US economic indicators could create volatility for the US dollar side of the pair. Traders should closely monitor whether AUD/USD can maintain support above its recent trendline and continue targeting higher Fibonacci resistance levels. Overall, AUD/USD daily analysis suggests that the bullish trend remains active, although short-term pullbacks or consolidation phases may appear before another major upward move.
Disclaimer: This AUDUSD analysis, provided by Unitedpips, is for informational purposes only and does not constitute trading advice. Always conduct your own Forex analysis before making any trading decisions.