XRP Technical Indicators Signal Continued Downtrend

Introduction to XRPUSD
The Ripple vs US Dollar pair—commonly referred to as XRP/USD—tracks the value of Ripple (XRP), often called “the banker’s cryptocurrency”, against the US Dollar, the world’s leading reserve currency. This pair is popular among traders due to Ripple’s fast cross-border transaction technology and active position within the digital payments sector. XRP’s price often reacts to both crypto-specific sentiment and broad macroeconomic factors tied to the US Dollar. Understanding how Ripple behaves against the USD helps traders anticipate shifts in momentum, volatility, and long-term direction.
XRP-USD Market Overview
The XRP-USD pair continues to trade under bearish pressure, reflecting the broader cooling in the cryptocurrency market while the US Dollar attempts to stabilize amidst mixed US economic data. Recent U.S. news shows delays in several major releases—such as the PCE Inflation Report, Personal Spending, and Personal Income—due to the government shutdown, shifting market expectations for USD volatility in the coming weeks. Despite these delays, traders remain attentive to inflation readings because PCE remains the Federal Reserve’s preferred measure, meaning any upside surprise could reinforce USD strength. Meanwhile, the University of Michigan Consumer Sentiment and Inflation Expectations figures remain key drivers for upcoming sessions, as stronger consumer confidence typically supports the USD. With these conditions, Ripple faces added downside pressure as the dollar maintains a relative advantage while the crypto market lacks strong bullish catalysts.
XRP/USD Technical Analysis
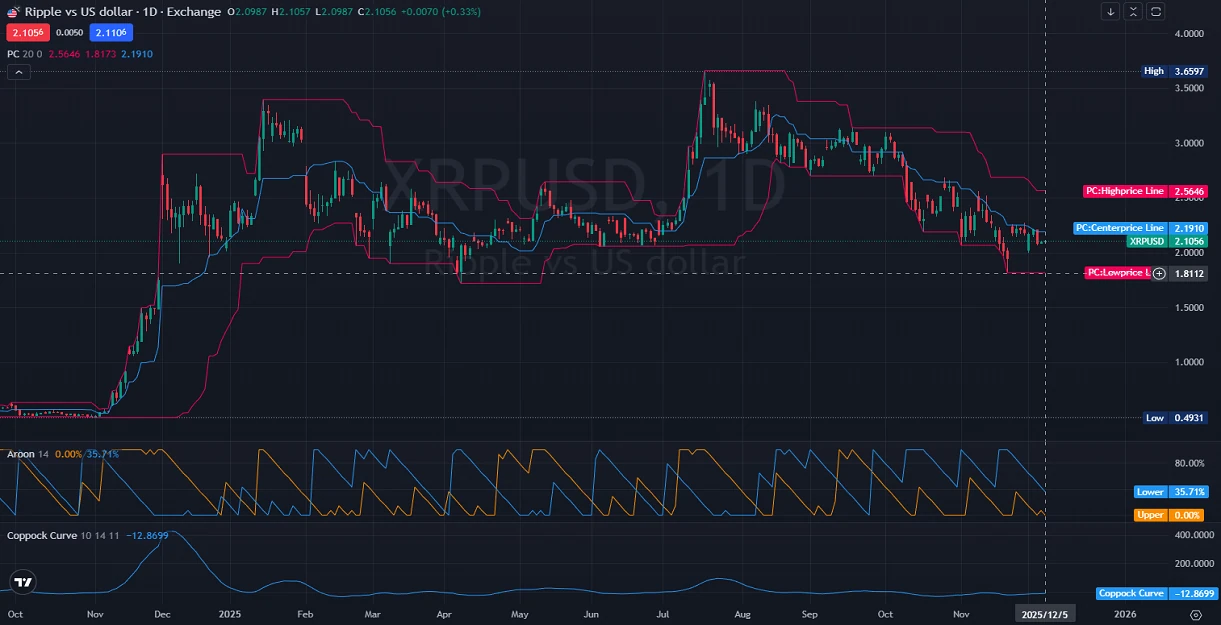
The daily chart for XRP vs US Dollar shows that after printing its all-time high at 3.6597 in July 2025, XRP has been in a persistent decline, dropping to the 2.0000 support area and briefly dipping below it. Price recently bounced from the lower boundary of the Price Channel, showing temporary corrective strength as it returned toward the center price zone around 2.1910. The Aroon indicator shows the Aroon-Lower rising to 35.71%, while the Aroon-Upper has crashed to 0.00%, confirming that bullish momentum is extremely weak and sellers still dominate, though short-term exhaustion may be present. Additionally, the Coppock Curve (10,14,11) sits at −12.8699, signaling continued long-term bearish pressure and suggesting that a meaningful upside reversal has not yet formed. Overall, Ripple remains technically bearish, and unless buyers reclaim the mid-channel resistance near 2.20–2.30, the pair risks retesting the 2.0000 psychological level.
Final Words about XRP vs USD
Given the overall technical and macroeconomic conditions, the Ripple-US Dollar pair currently faces a challenging environment with bearish pressure dominating the daily outlook. The weakening of bullish indicators and the strong position of the USD—supported by upcoming high-impact inflation and consumer data—suggest Ripple may have difficulty recovering in the short term. Traders should closely monitor price behavior near the 2.0000 support region, as a clean break below could open the door to deeper declines. However, if Ripple can hold above this zone and regain traction above the channel center line, a medium-term recovery may emerge. Until then, cautious trading and strict risk management remain essential in navigating the next moves for Ripple against the US Dollar.
Disclaimer: This XRPUSD analysis, provided by Unitedpips, is for informational purposes only and does not constitute trading advice. Always conduct your own Forex analysis before making any trading decisions.
Related Posts

EURGBP Price Action Holds Bearish Consolidation
Introduction to EUR-GBPThe EUR-GBP pair shows the exchange rate between the Euro and the British…
NZD/USD Forecast: Consolidation Before Major Move
Introduction to NZDUSDThe NZD USD pair, commonly known as the “Kiwi”, represents the exchange rate…
Gold Outlook: US Inflation Data In Focus
Introduction to Gold/USDThe XAU/USD pair represents the value of Gold against the US Dollar and…