EUR-USD Daily Outlook: Fiber Under Pressure Amid US Shutdown

Introduction to EURUSD
The EURUSD currency pair, frequently referred to by its popular nickname “Fiber,” represents the exchange rate between the Euro and the U.S. Dollar. As the most liquid and widely traded pair in the global foreign exchange market, it serves as a primary barometer for the economic health of both the Eurozone and the United States. The nickname “Fiber” is thought to derive either from the cotton fiber used in Euro banknotes or from the fiber optic cables that transmit exchange rate data between continents. Knowing how EUR USD moves helps traders navigate the broader sentiment across all financial asset classes.
EUR-USD Market Overview
The EUR-USD remains under significant pressure, currently following a downward trend influenced by both market behavior and recent economic disruptions. While a 43-day government shutdown was temporarily resolved in November 2025, significant uncertainty remains as current federal funding is set to expire on January 30, 2026. This fiscal gridlock has led to major delays in critical economic data releases, including simultaneous monthly releases for Producer Price Index (PPI) and Retail Sales originally slated for late 2025. In the Eurozone, the Bundesbank recently conducted a 30-year bond auction, providing investors with insight into long-term interest rate outlooks and market liquidity. Looking ahead, multiple Federal Reserve members, including Presidents Paulson, Bostic, and Kashkari, are scheduled to speak, and their “hawkish” or “dovish” cues are expected to be the dominant drivers for the pair in the near term.
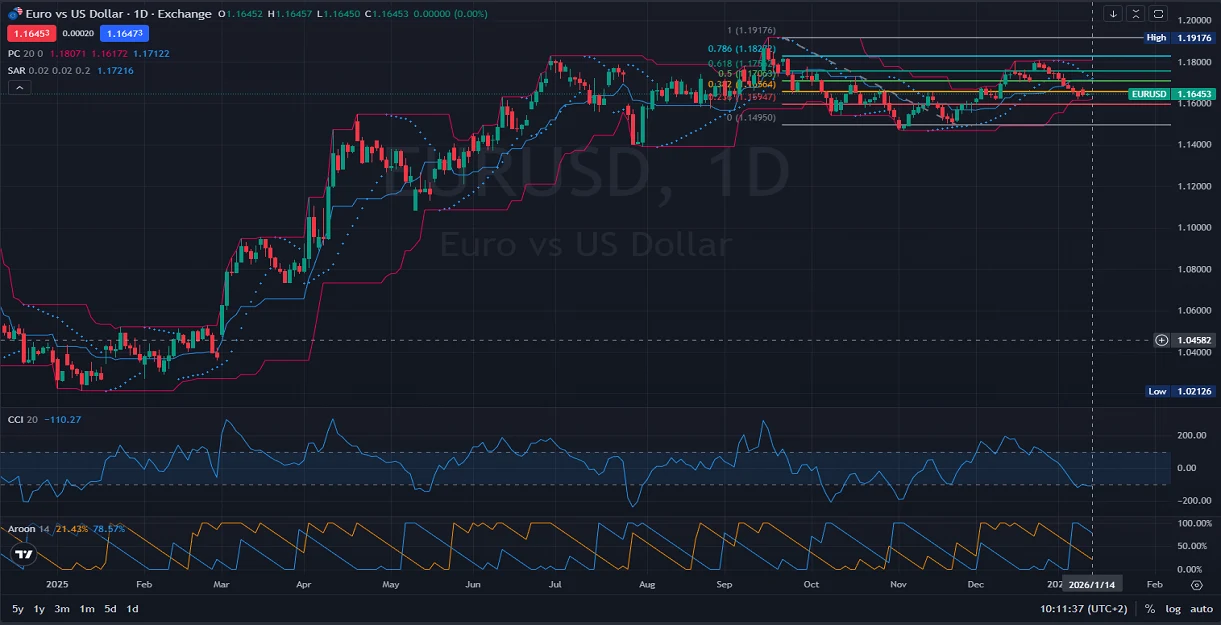
EUR/USD Technical Analysis
Looking at the daily chart (D1) of EUR/USD, the price action continues its descending movement started at the beginning of 2026, trading below the center line of the price channel. The pair has already passed the 0.618 and 0.5 Fibonacci levels and is currently hovering around the 0.382 level, examining it for a potential breakout. A strong support zone has been identified between the 0.236 and 0.382 Fibonacci retracement levels, which is also where the lower half of the current price channel resides. Indicators confirm this bearish momentum: the Parabolic SAR blue dots are positioned above the candles, and the Commodity Channel Index (CCI 20) has reached -110.27, signaling oversold conditions. Furthermore, the Aroon indicator shows a clear bearish dominance with the Down line at 78.57% and the Up line at 21.43%.
Final Words about EUR vs USD
Given the current market and economic signals, EUR/USD appears likely to maintain its downward trajectory in the immediate future. Traders should closely monitor the support zone between 0.236 and 0.382 Fibonacci for signs of a deeper breakdown or a temporary relief bounce. The heavy schedule of Federal Reserve speakers will be critical, as any hawkish sentiment could further bolster the US Dollar against the Euro. Additionally, the looming January 30 deadline for US government funding will likely keep volatility elevated as markets price in fiscal risks. Maintaining a strict risk management plan is essential, as the combination of delayed economic data and geopolitical uncertainty can lead to unpredictable price swings.
Disclaimer: This EURUSD analysis, provided by Unitedpips, is for informational purposes only and does not constitute trading advice. Always conduct your own Forex analysis before making any trading decisions.
Related Posts

Bitcoin Daily Chart: Keltner Confirms Downtrend
Introduction to BTC/USDThe BTC USD pair tracks the value of Bitcoin priced in US dollars,…
USD/CAD Daily Analysis: Loonie Faces Key Resistance
Introduction to USDCADThe USD CAD currency pair, often referred to as the “Loonie,” represents the…
EUR/JPY Daily Analysis: Key Technical and Fundamental Insights
Introduction to EURJPYEURJPY, often referred to as "Euppy," is a significant currency pair in forex…