Navigating Volatility: BTC/USD Market Update

Introduction to BTCUSD
The BTC/USD pair represents the exchange rate between Bitcoin, popularly known as “digital gold,” and the United States dollar, the world’s dominant fiat currency. This pairing is critical in cryptocurrency markets as it gauges Bitcoin’s value against a globally recognized benchmark. Traders and investors utilize BTC/USD extensively for portfolio diversification, speculative trades, and hedging against traditional market risks.
BTC USD Market Overview
BTCUSD currently demonstrates notable volatility, showcasing downward pressure influenced by market sentiment and recent economic events. After experiencing bullish movements, Bitcoin’s recent sharp decline suggests market indecisiveness ahead of key price points. Global financial headlines indicate cautious market behavior following Bitcoin’s latest price swings, emphasizing the pair’s sensitivity to macroeconomic indicators and investor sentiment shifts. Traders remain cautious, assessing recent US economic data, inflation updates, and investor risk appetite that may influence the USD’s strength against Bitcoin. The upcoming trading days will likely see continued fluctuations, with traders carefully monitoring support and resistance levels for potential breakouts or further consolidations.
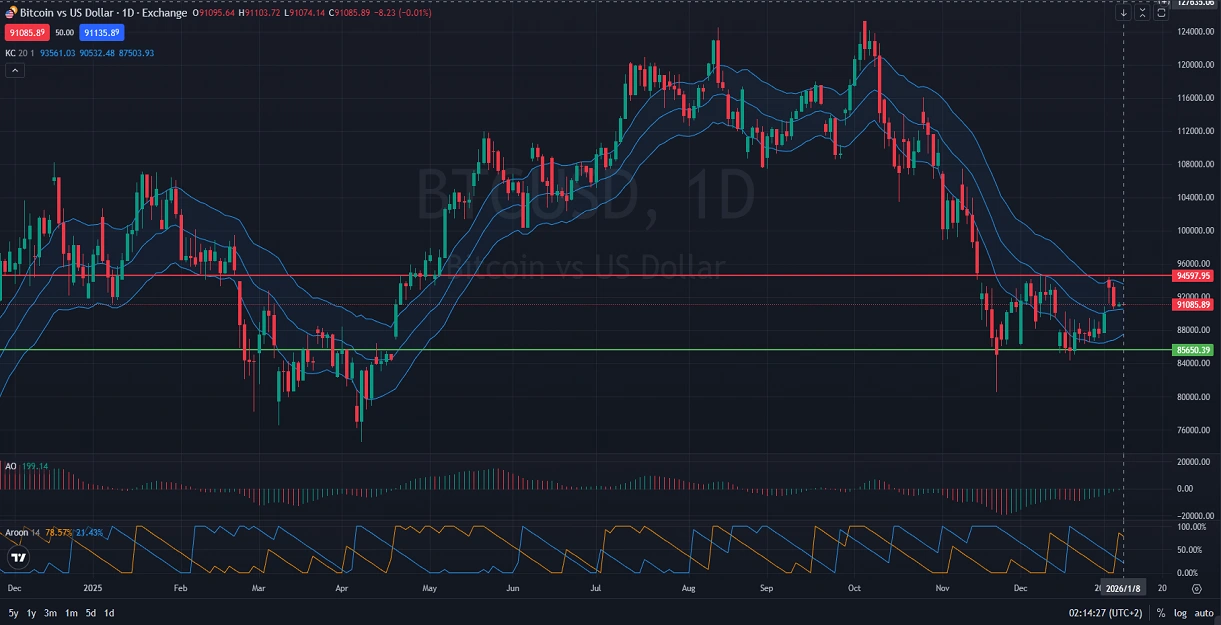
BTC/USD Technical Analysis
Analyzing the daily BTC USD chart indicates recent bearish price action following a prolonged bullish trend. BTC/USD currently exhibits indecision, oscillating between resistance at $94,597.95 and support at $85,650.39. Recent candlestick formations, including the hanging man followed by bearish candles, suggest possible short-term bearish momentum. The Keltner Channels, with boundaries at $93,561.03 (upper), $90,532 (middle), and $87,503.93 (lower), indicate potential volatility and a critical price range for traders. The Awesome Oscillator, showing a positive but weakening value at 199.14, signals reduced bullish momentum. Moreover, the Aroon indicator (78.57% bearish and 21.43% bullish) supports the view of weakening bullish activity, indicating caution in the short term.
Final Words About BTC vs USD
In conclusion, BTC-USD appears poised for continued short-term volatility and potential bearish pressure. Traders should closely monitor price reactions at the key resistance of $94,597.95 and support of $85,650.39. While immediate trends point towards bearish scenarios, historical price behavior of Bitcoin suggests the potential for a renewed bullish drive following consolidation phases. Investors should maintain disciplined risk management strategies and keep abreast of key US economic news and global market sentiment to better navigate possible market shifts.
Disclaimer: This BTCUSD analysis, provided by Unitedpips, is for informational purposes only and does not constitute trading advice. Always conduct your own Forex analysis before making any trading decisions.
Related Posts

USD/CHF Forecast: Key Economic Events to Dictate Price Action
Introduction to USDCHFUSD CHF, commonly referred to as the "Swissie," represents the exchange rate between…
EURGBP Daily Analysis: Euro and British Pound Trends
Introduction to EUR/GBPEUR/GBP, commonly known as "Chunnel," represents the exchange rate between the Euro and…
EUR/USD: Awaiting Central Banks’ Next Moves
Introduction to EURUSD The EUR USD pair, commonly referred to as "Fiber," represents the exchange…