BTC/USD Daily Analysis: Market Trends and Price Forecast

Introduction to BTC USD
The BTC-USD pair, often referred to simply as Bitcoin vs. US Dollar, is among the most crucial trading pairs in the cryptocurrency market. Bitcoin, known as “digital gold,” represents the forefront of cryptocurrencies, while the US dollar remains the global reserve currency. Investors and traders closely follow BTC/USD to gauge market sentiment, volatility, and potential investment opportunities. The dynamics between Bitcoin and the US dollar can offer insights into broader economic trends and digital asset adoption.
BTCUSD Market Overview
The BTC USD pair is currently experiencing a mixed market sentiment due to recent economic developments in the United States. Data from the National Association of Realtors indicates changes in pending home sales, which often serve as a precursor to broader economic activity. Additionally, crude oil inventory levels, reported by the Energy Information Administration (EIA), impact the overall market sentiment indirectly, affecting currency strength and economic outlook. Recent announcements from the Federal Reserve, particularly regarding interest rates and monetary policy statements, continue to influence market expectations. Traders should watch closely for signals from upcoming Fed announcements and the impact these may have on the strength of the US dollar, potentially affecting the BTC/USD valuation.
BTC/USD Technical Analysis
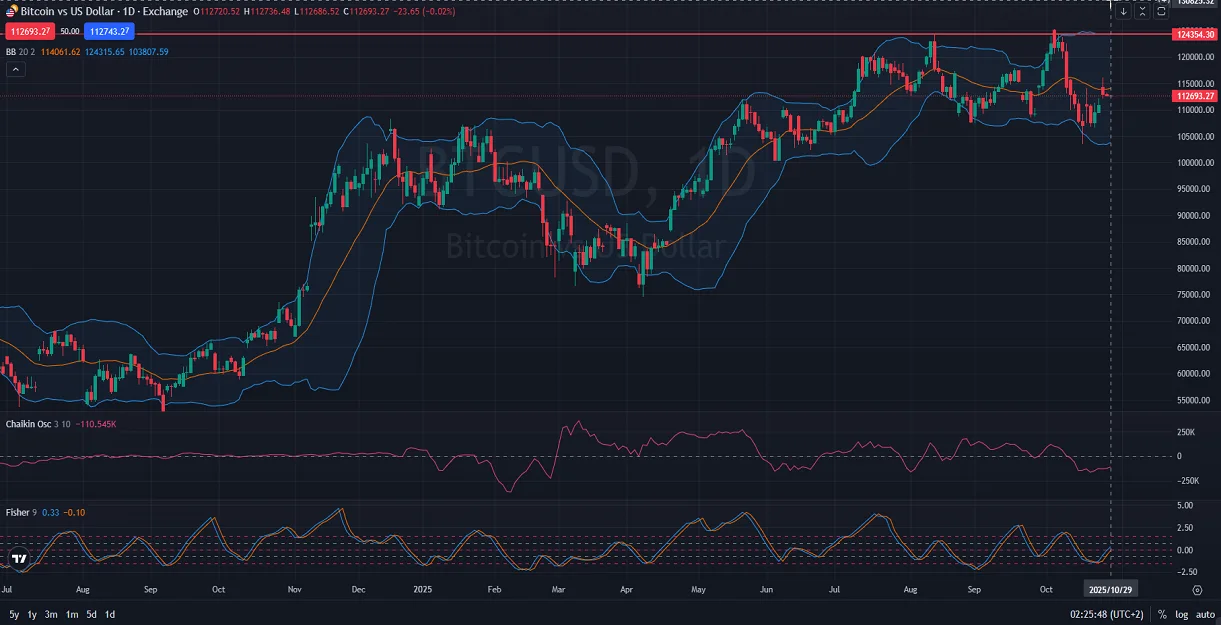
On the daily timeframe, BTC USD shows signs of mixed market momentum with recent candles forming lower lows, suggesting a possible shift from a previously bullish to a side or bearish sentiment. Significant resistance is present around the level of 124354.30, a critical area where price action has previously encountered substantial resistance. The Chaikin Oscillator currently sits at -10.54K, indicating reduced buying pressure and highlighting potential bearish sentiment in the market. The Fisher indicator is somewhat bullish, with the Fisher line at 0.33 and the Trigger line at -0.10, suggesting cautious optimism. Price action is currently hovering around the middle band of the Bollinger Bands, showing indecision and equilibrium in the short-term outlook.
Final Words about BTC vs USD
In conclusion, BTC/USD is at a pivotal juncture with potential indications of shifting momentum from bullish to neutral or bearish trends. Traders should monitor key resistance and support levels, especially around 124354.30, to make informed trading decisions. Economic data from the US, particularly related to housing markets, crude inventories, and Federal Reserve monetary policy, should be closely observed as these factors will likely influence price volatility in the short term. As always, incorporating risk management strategies is vital due to the inherent volatility and unpredictability of Bitcoin trading.
Disclaimer: This BTCUSD analysis, provided by Unitedpips, is for informational purposes only and does not constitute trading advice. Always conduct your own Forex analysis before making any trading decisions.
Related Posts

Euro Canadian Dollar Analysis Before ECB Signals
Introduction to EUR/CADThe EUR/CAD pair shows how the Euro is performing against the Canadian Dollar…
USDJPY Daily Analysis: Strong Bullish Momentum Continues
Introduction to USD/JPYThe USD JPY pair, often referred to as the “Gopher,” represents the exchange…
BTC/USD Technical Analysis After Major Downtrend
Introduction to BTCUSDThe BTC/USD pair, commonly known as Bitcoin vs US Dollar, represents the value…