GBP/USD Daily Technical and Fundamental Milestones

Introduction to GBP/USD
GBP/USD, often referred to as “Cable,” is one of the most widely traded currency pairs in the forex market. It represents the exchange rate between the British pound sterling and the US dollar. This pair is influenced by economic data, interest rate decisions, and political developments from both the United Kingdom and the United States. As two of the world’s largest and most developed economies, movements in GBP/USD are closely tied to central bank policies—particularly those of the Bank of England and the Federal Reserve—as well as macroeconomic indicators such as GDP, inflation, and employment figures. Traders monitor this pair to gauge relative economic strength and capitalize on volatility driven by geopolitical events and market sentiment.
GBP/USD Market Overview
Currently, GBP/USD shows a bullish market sentiment, bolstered by stronger-than-expected UK inflation data. The latest Consumer Price Index (CPI) rose 3.3% year-over-year, well above the forecasted 2.6%, while Core CPI and Retail Price Index (RPI) also exceeded expectations. These figures suggest persistent inflationary pressures in the UK, increasing the likelihood of a more hawkish stance from the Bank of England. On the US side, a larger-than-expected draw in crude oil inventories and upcoming speeches from FOMC members Thomas Barkin and Michelle Bowman could influence USD direction. Should their remarks indicate a continued tightening bias, it may strengthen the dollar and limit GBP/USD’s upside. However, any dovish signals or market concerns over US growth could reinforce the pair’s bullish trajectory. Traders should monitor these developments closely, as they are likely to set the tone for short-term price action.
GBP/USD Technical Analysis
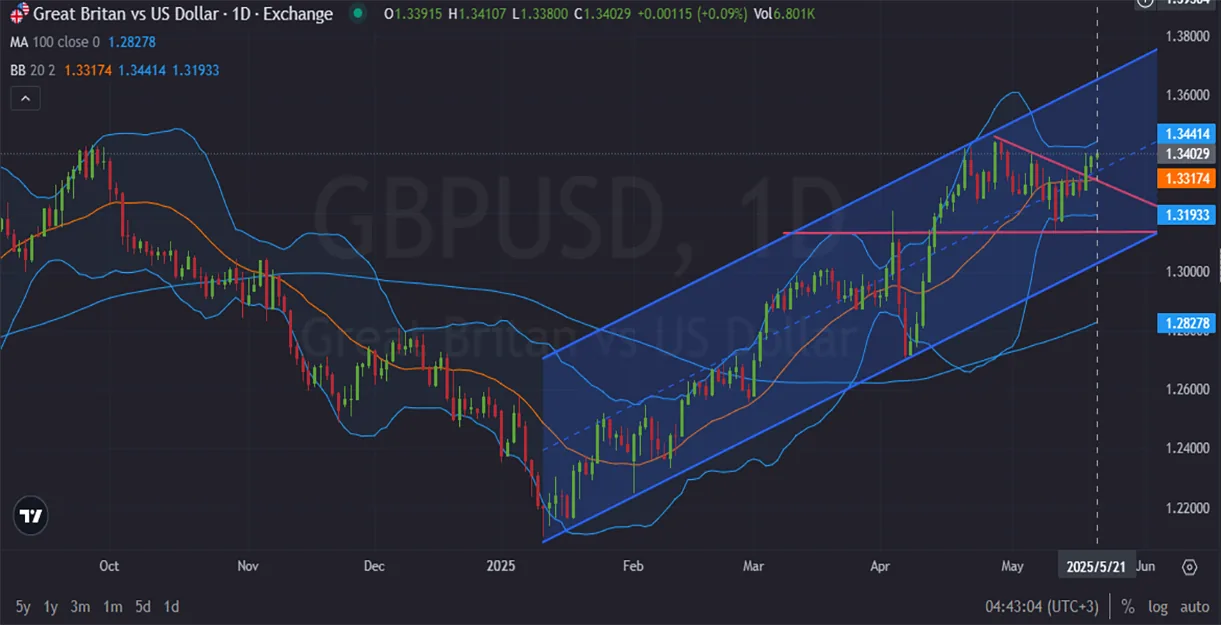
Analyzing the daily timeframe (D1) for GBP/USD, the pair is currently displaying bullish momentum within a well-defined ascending channel. Price action has recently broken out of a consolidation triangle, with strong support around the 1.3193 level and resistance near 1.3441. The Bollinger Bands show price expanding toward the upper band, suggesting increased volatility and buying pressure. Moreover, the 100-day moving average (MA) at 1.2828 remains well below the current price, reinforcing the longer-term bullish trend. The pair’s recent bounce from mid-channel support, coupled with stronger-than-expected UK inflation data, strengthens the outlook for continued upside toward the 1.3440–1.3500 resistance zone. Traders should watch for confirmation of sustained breakout above the consolidation range as a signal for trend continuation.
Final Words about GBP vs USD
GBP/USD continues to attract strong interest from traders amid a favorable blend of technical and fundamental signals. With UK inflation exceeding forecasts and the pair holding firmly above key support levels within an ascending channel, the overall outlook remains bullish. Technical indicators, including the 100-day moving average and expanding Bollinger Bands, support the case for further upside. However, potential shifts in US monetary policy, especially following key speeches from FOMC officials, could introduce short-term volatility. As such, traders should remain vigilant, balancing the current bullish bias with awareness of upcoming macroeconomic events that may influence market direction.
Related Posts

USD/JPY Daily Analysis: Uptrend Faces Key Test
Introduction to USDJPYThe USD-JPY pair, commonly known as the “Gopher,” reflects the exchange rate between…
Bitcoin Struggles Under Bearish Pressure Below Key Fibonacci Levels
Introduction to Bitcoin vs. US DollarThe Bitcoin vs. US Dollar pair, often referred to by…
GBP/USD Forecast with Retail Sales and Fed Focus
Introduction to GBP/USDThe GBP/USD pair, widely known as “Cable,” reflects the exchange rate between the…