GBP/USD Daily Analysis: Technical Levels and Key Indicators

Introduction to GBPUSD
GBPUSD, popularly known as the “Cable,” represents the exchange rate between the British Pound and the US Dollar. It is among the most traded forex pairs globally, reflecting the economic dynamics of the United Kingdom and the United States. Traders frequently analyze this currency pair to capitalize on fluctuations influenced by macroeconomic news, interest rate decisions, and geopolitical events.
GBP-USD Market Overview
The GBP-USD pair currently reflects cautious market sentiment influenced by critical economic announcements from both sides of the Atlantic. The USD is under scrutiny as markets await commentary from Federal Reserve FOMC member Beth Hammack regarding future monetary policies and balance sheet adjustments. Stronger-than-expected US jobless claims and durable goods orders could reinforce bullish sentiment for the USD. Conversely, the GBP’s direction hinges on remarks from Bank of England Deputy Governor Clare Lombardelli and the upcoming IMF meeting outcomes addressing global economic stability. Markets are cautious as these speeches and data releases could introduce volatility and clearer directional cues for the GBP USD.
GBP USD Technical Analysis
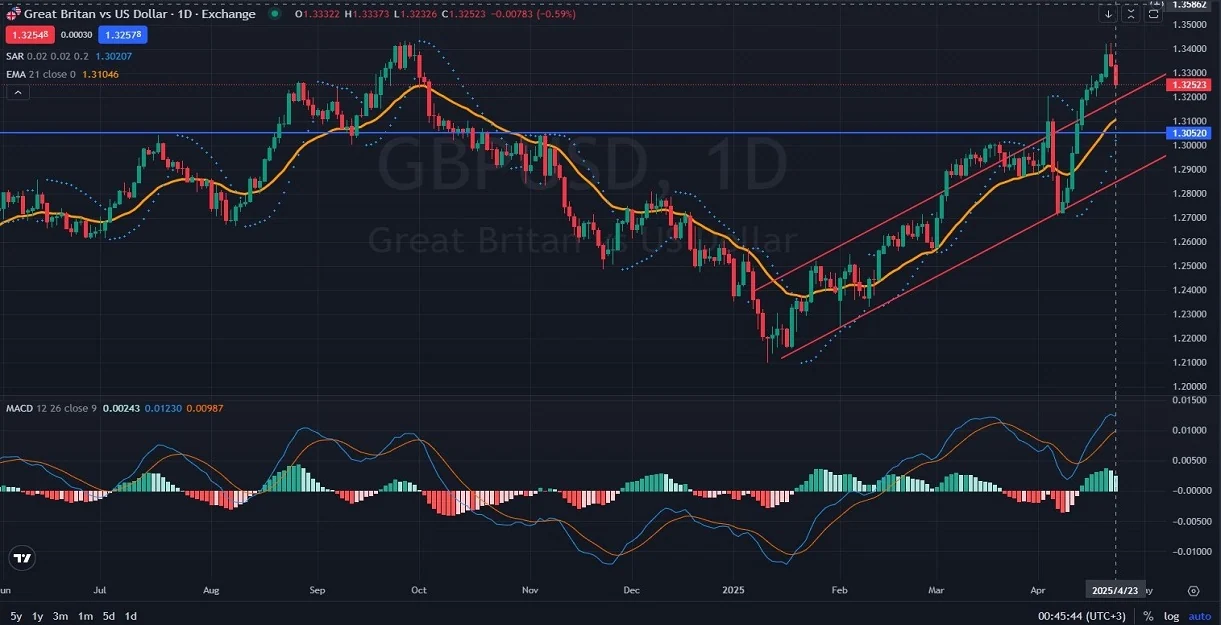
Analyzing the GBP-USD daily chart, the price recently broke upward from a rising channel and is now experiencing a pullback towards critical support levels. Key areas of interest include the channel’s support line, the horizontal trend line around 1.3052, and the EMA 21, currently situated near 1.3104. Additionally, the Parabolic SAR indicator signals potential short-term bearish momentum, indicating downward pressure. The MACD indicator has started converging, suggesting weakening bullish momentum and potentially signaling further correction toward identified support zones. Traders should closely monitor these levels for potential reversals or continued corrections.
Final Words about GBP vs USD
Given the current market conditions and the technical setup, GBP/USD could see continued corrective movements in the short term. Traders must pay close attention to fundamental developments, particularly statements from central bank officials and key economic indicators, to gauge future trends accurately. The identified support zones at EMA 21 and the horizontal trend line could serve as important pivot points for potential price reversals or continuation patterns. Careful risk management and vigilance are recommended, as heightened volatility is likely during upcoming economic events and announcements.
Related Posts

USD/CAD Daily Analysis: Loonie Faces Key Resistance
Introduction to USDCADThe USD CAD currency pair, often referred to as the “Loonie,” represents the…
EUR/JPY Daily Analysis: Key Technical and Fundamental Insights
Introduction to EURJPYEURJPY, often referred to as "Euppy," is a significant currency pair in forex…
AUD/USD Technical Outlook: Bullish Momentum Faces Major Resistance
Introduction to AUDUSDThe AUD USD pair, commonly referred to as the "Aussie," measures the value…