Cable Pair Tests Key Support Level as US Dollar Strengthens

Introduction to GBP vs USD
The GBP/USD currency pair, commonly known as “Cable,” reflects the exchange rate between the British pound (GBP) and the US dollar (USD). This major forex pair is heavily influenced by economic and political factors from both the UK and the US. The pair tends to be highly volatile during significant economic events and news, providing numerous opportunities for traders who keep an eye on macroeconomic trends and global financial market developments. As one of the oldest traded forex pairs, GBP/USD remains a popular choice among traders looking for exposure to both currencies.
GBP/USD Market Overview
Today, the GBP/USD pair is experiencing heightened volatility driven by economic events in both the UK and the US. On the UK side, the market is focused on a key speech by the Bank of England’s (BOE) Chief Economist, Huw Pill, at the Institute of Chartered Accountants’ Annual Conference. His remarks, especially if they signal a more hawkish stance on monetary policy, could provide a boost to the pound. In addition, S&P Global released the latest Construction PMI data, a critical indicator of UK economic health. In the US, traders are eyeing labor market data, including the Non-Farm Payrolls (NFP) report and Unemployment Rate, both of which are crucial for gauging the health of the US economy. Positive results from this data could push the USD higher, increasing downward pressure on the GBP/USD pair. The coming days are expected to be highly eventful as markets digest these economic developments.
GBP/USD Technical Analysis
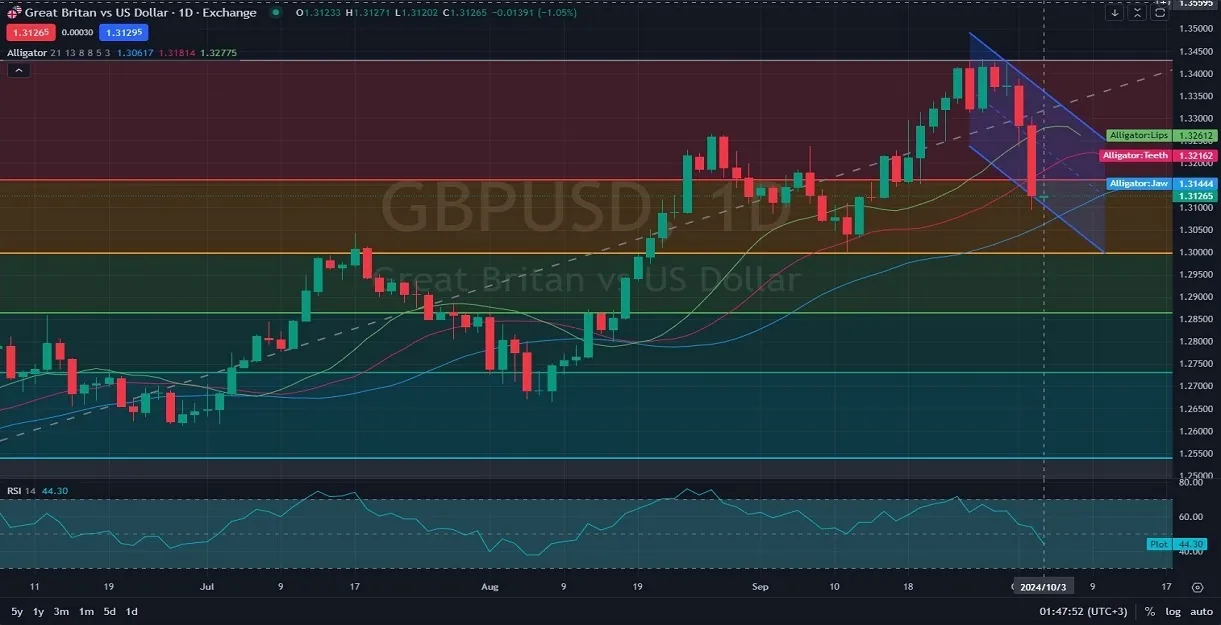
The GBP/USD daily chart displays bearish momentum, with the price currently moving within a downward channel. The Alligator indicator, consisting of the green lips, red teeth, and blue jaws, suggests a bearish trend as all three lines are moving downward in parallel. The current price of 1.31265 is below the Alligator’s jaws (1.31444), which confirms the ongoing sell-off. Moreover, the RSI (Relative Strength Index) is at 44.30, indicating mild bearishness but not yet in oversold territory, leaving room for further declines. The price action is also respecting Fibonacci retracement levels, with the 61.8% Fib level at 1.31265 serving as a key support level. If the price breaks below this level, it could test further supports around the 1.30500 area. Overall, the technical indicators point to continued bearish pressure unless significant news triggers a reversal.
Final Words about GBP USD
The GBP/USD pair is currently under bearish pressure due to a combination of technical signals and economic uncertainty. Traders should keep a close eye on Huw Pill’s speech, as well as the US Non-Farm Payrolls data, as these could drive significant volatility in the coming sessions. A stronger USD could lead the pair to further declines, especially if the UK’s economic outlook continues to remain uncertain. On the other hand, any signs of a more hawkish BOE could provide support to the pound, potentially reversing the current downward trend. As always, risk management is essential in these volatile times, with careful attention to support and resistance levels.
Related Posts

USD/CAD Daily Analysis: Loonie Faces Key Resistance
Introduction to USDCADThe USD CAD currency pair, often referred to as the “Loonie,” represents the…
EUR/JPY Daily Analysis: Key Technical and Fundamental Insights
Introduction to EURJPYEURJPY, often referred to as "Euppy," is a significant currency pair in forex…
AUD/USD Technical Outlook: Bullish Momentum Faces Major Resistance
Introduction to AUDUSDThe AUD USD pair, commonly referred to as the "Aussie," measures the value…