EUR/USD Key Technical Levels to Watch

Introduction to EUR/USD
The EUR/USD currency pair, representing the exchange rate between the Euro and the U.S. Dollar, is a major instrument in the forex market. The pair’s movements are influenced by various economic indicators, central bank policies, and overall market sentiment. In the current context, upcoming economic data releases from both the Eurozone and the United States, along with recent technical price action, are providing important insights for traders.
EUR/USD Daily Market Overview
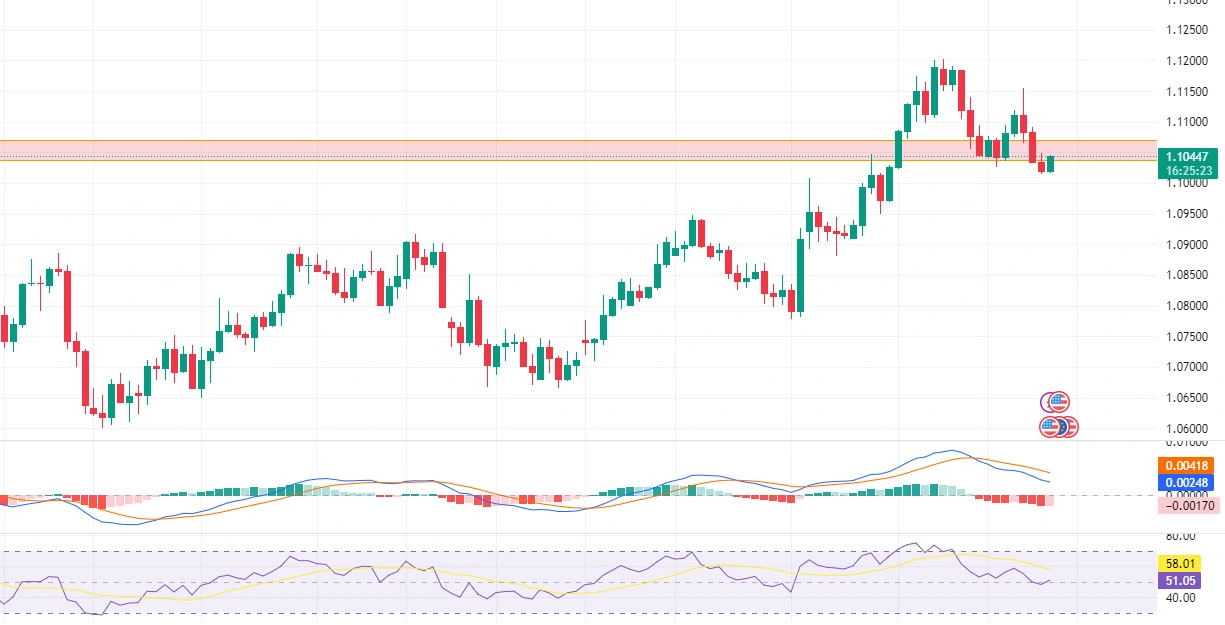
The EUR/USD pair recently entered a bearish wave after breaking through an important support zone, as shown on the daily chart. The price has retraced and is now testing this zone as resistance. This retest could confirm the strength of the bearish move, setting the stage for a continuation of the downward trend. Traders are watching for signs that the pair will resume its bearish trajectory in the coming sessions.
On the economic front, key U.S. data points, such as the Core CPI and CPI figures, are expected to come in line with previous readings at 0.2% m/m for both indicators. The CPI y/y, however, is projected to drop from 2.9% to 2.5%, which could ease some pressure on the USD if inflation cools down as expected. These releases will be pivotal in driving EUR/USD price action later today, adding to the technical developments seen on the chart.
EUR/USD Technical Analysis
From a technical standpoint, the daily chart shows that the pair is now testing the recently broken support zone, which has turned into resistance near the 1.1050-1.1070 range. A failure to break back above this level could reaffirm the bearish structure and lead to further declines. The MACD indicator shows bearish momentum building, while the RSI has not yet reached oversold territory, suggesting there is more room for the downside.
If the resistance holds, the next support levels to watch are the 1.0990 and 1.0930 regions, which correspond to key Fibonacci retracement levels. A break below these levels could lead to a more significant bearish move. On the flip side, if the pair manages to break back above the resistance zone, a shift in momentum could occur, with 1.1120 being the next target.
Final Thoughts on EUR/USD Daily Chart
With the EUR/USD pair at a pivotal technical juncture and major U.S. inflation data on deck, the next few sessions could bring heightened volatility. A failure to break above the retested resistance zone might confirm the continuation of the bearish trend, while a surprise in the inflation data could add further momentum to the USD. Traders should watch for a confirmed break in either direction before committing to a trading strategy, using both technical and fundamental insights to navigate the market effectively.
Related Posts

GBP/USD Forecast with Retail Sales and Fed Focus
Introduction to GBP/USDThe GBP/USD pair, widely known as “Cable,” reflects the exchange rate between the…
XAG/USD Analysis: Sellers Dominate the Market Trend
Introduction to SilverThe Silver vs US Dollar (XAG/USD) pair, commonly known as Silver, reflects the…
AUD/USD Daily Analysis: Aussie Faces Key Resistance
Introduction to AUD/USDThe AUD/USD pair, widely known as the “Aussie,” reflects the value of the…